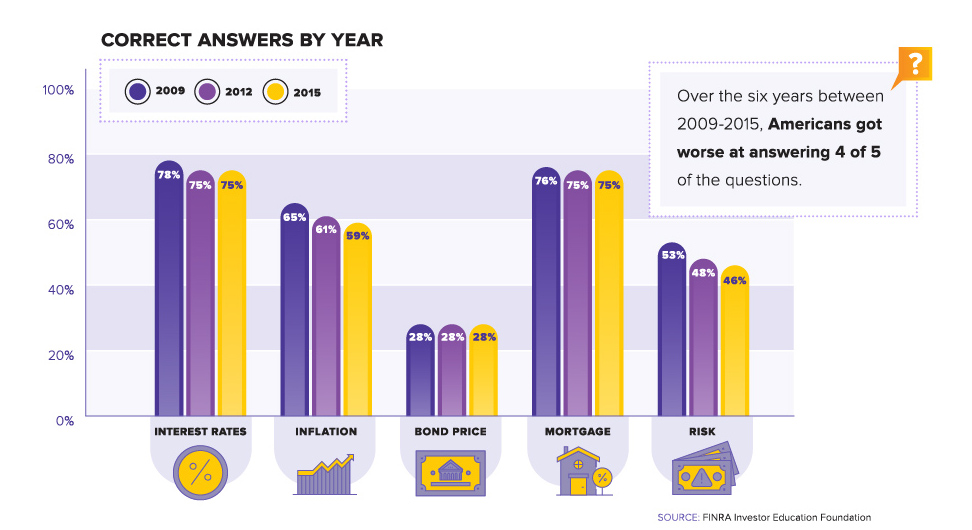
Financial literacy has been dropping for years in the United States - and with student debt at all-time highs, how do we put our students in...
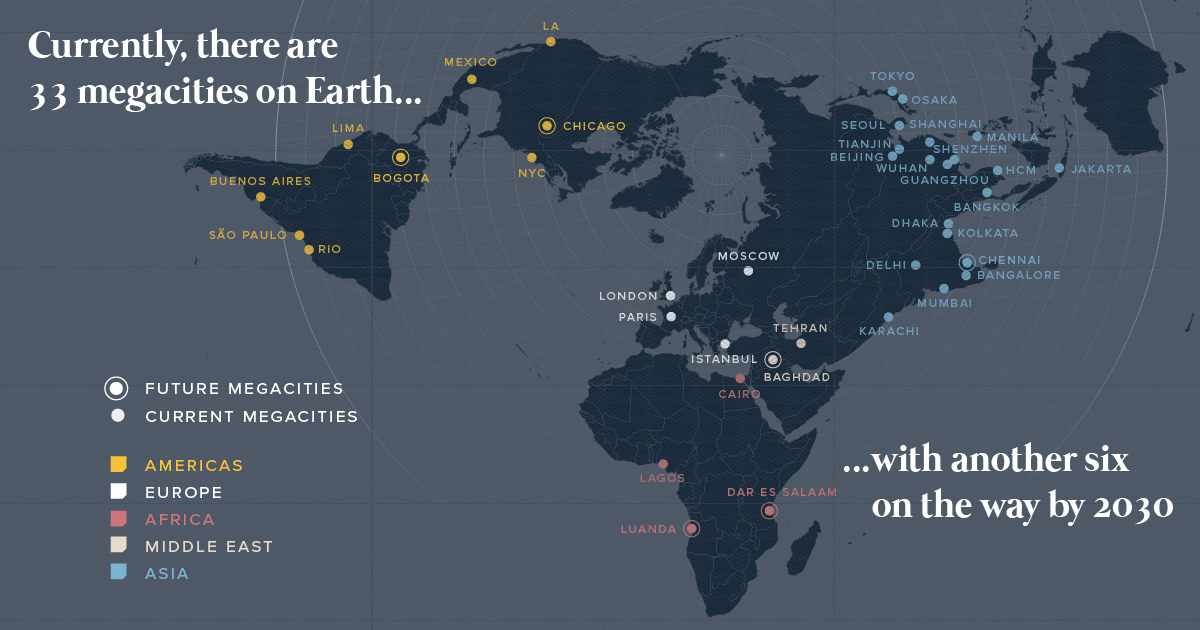
There are currently 33 megacities in the world with over 10 million inhabitants - but by 2030, there will be six new megacities, including one in...
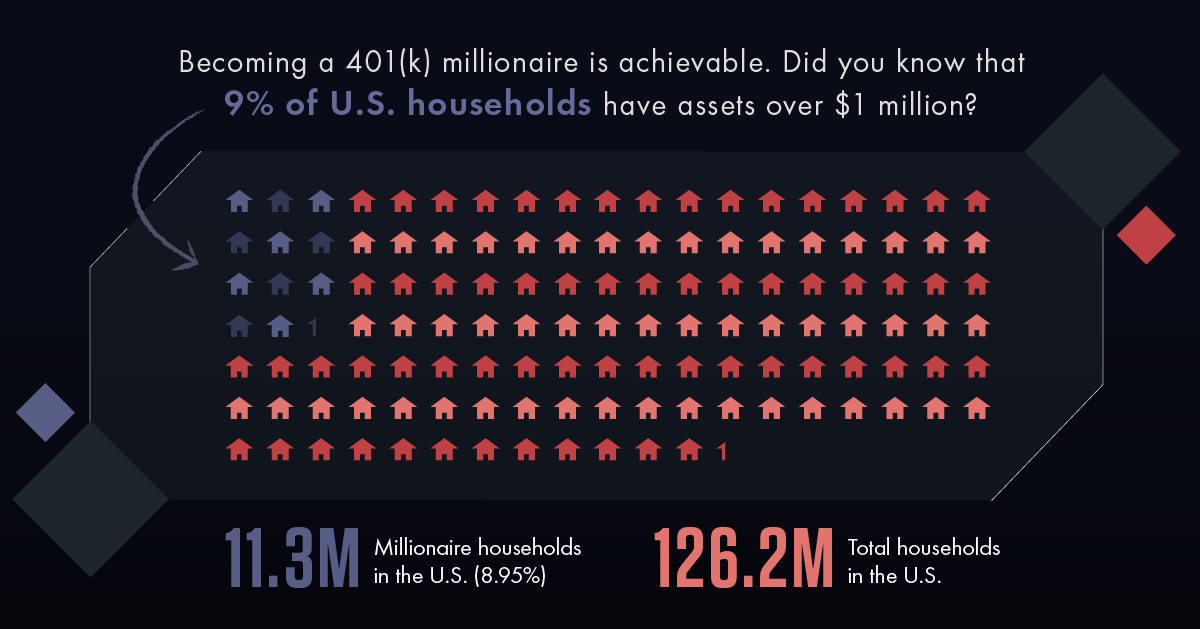
Millionaires are more common than you may think - here are the steps you need to take with your retirement investments to become a 401(k) millionaire.
Massive amounts of data, the use of biometrics, the fintech boom, and neural networks are just some trends shaping the future of consumer credit.
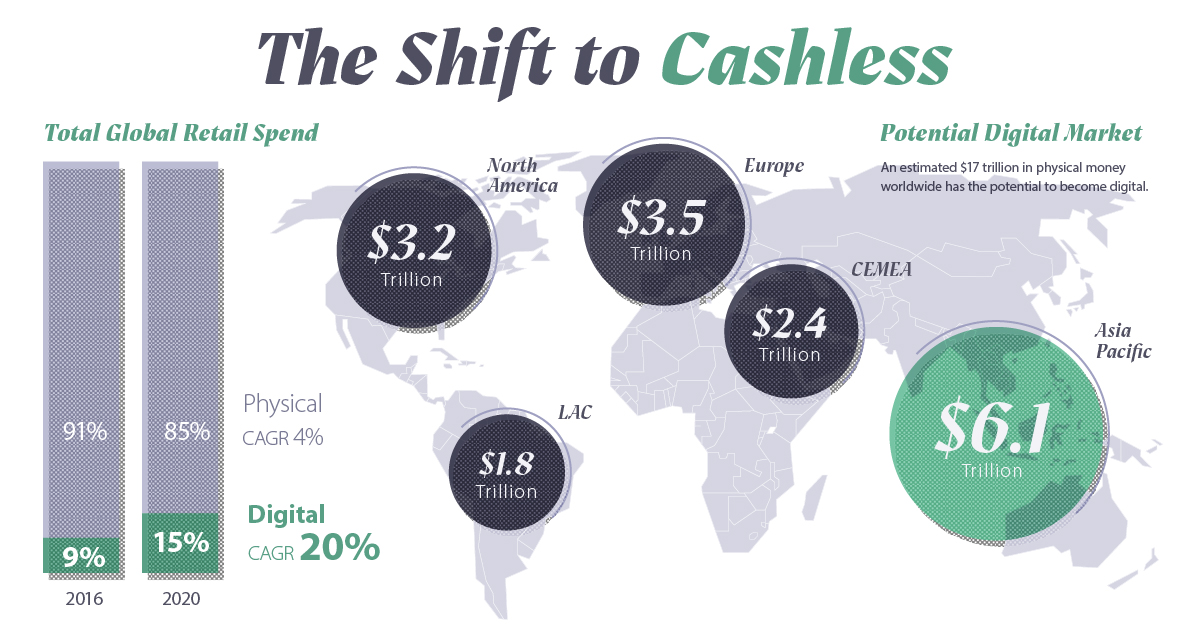
Payments are increasingly cashless and mobile, and card linked offers present a new opportunity for businesses to create successful customer rewards programs.
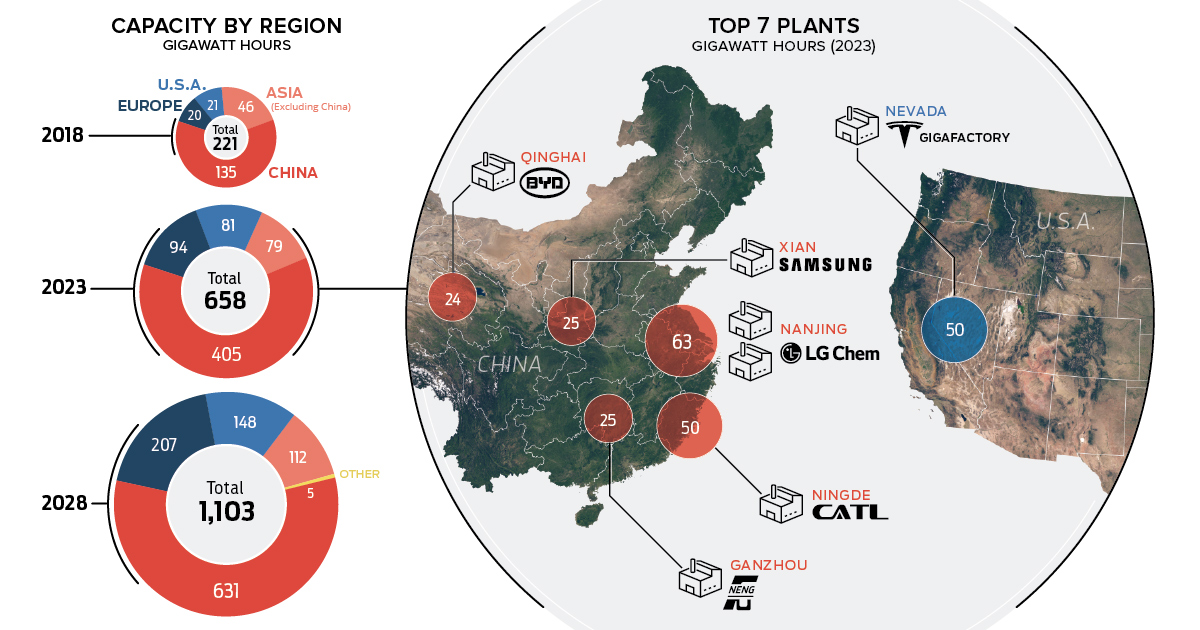
In just a decade, there will be the equivalent lithium-ion battery production capacity of 22 Tesla Gigafactories, with most of that being in China.

These maps of North America and Europe use a deceivingly simple method to plot population density: replacing each town with a single dot.
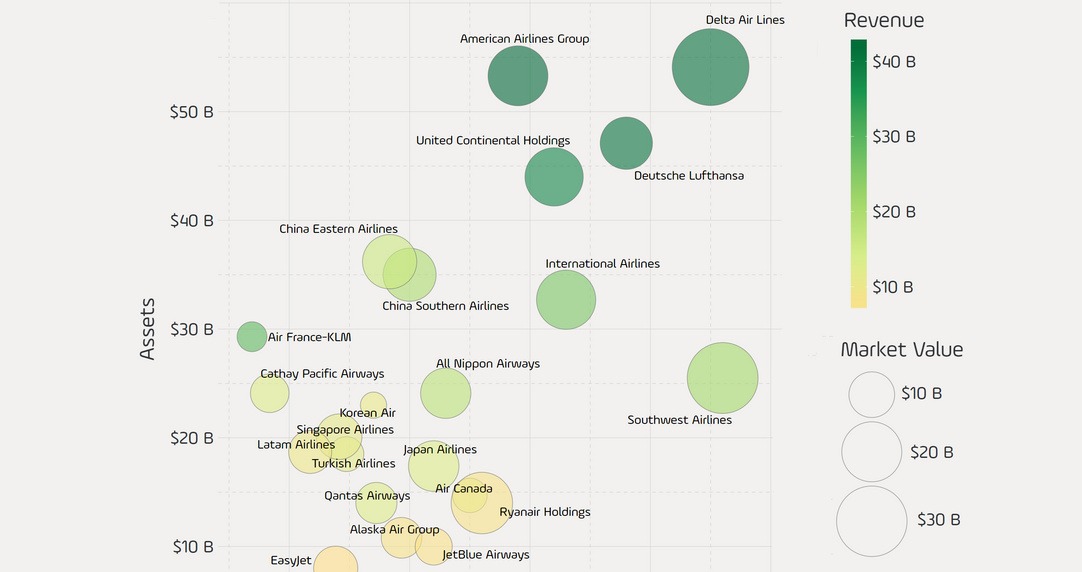
Comparing the largest public-traded airline companies in the world, based on revenue, profit, assets, and market capitalization.
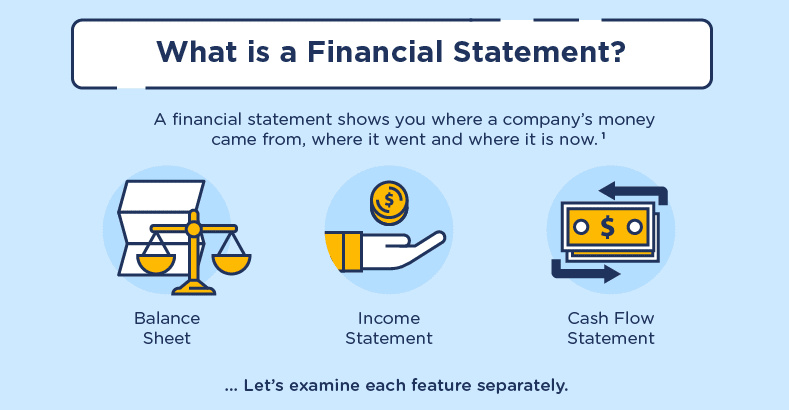
Fewer entrepreneurs today have formal business training. While the financial statement is not a glorified part of the startup dream, it's essential learning.
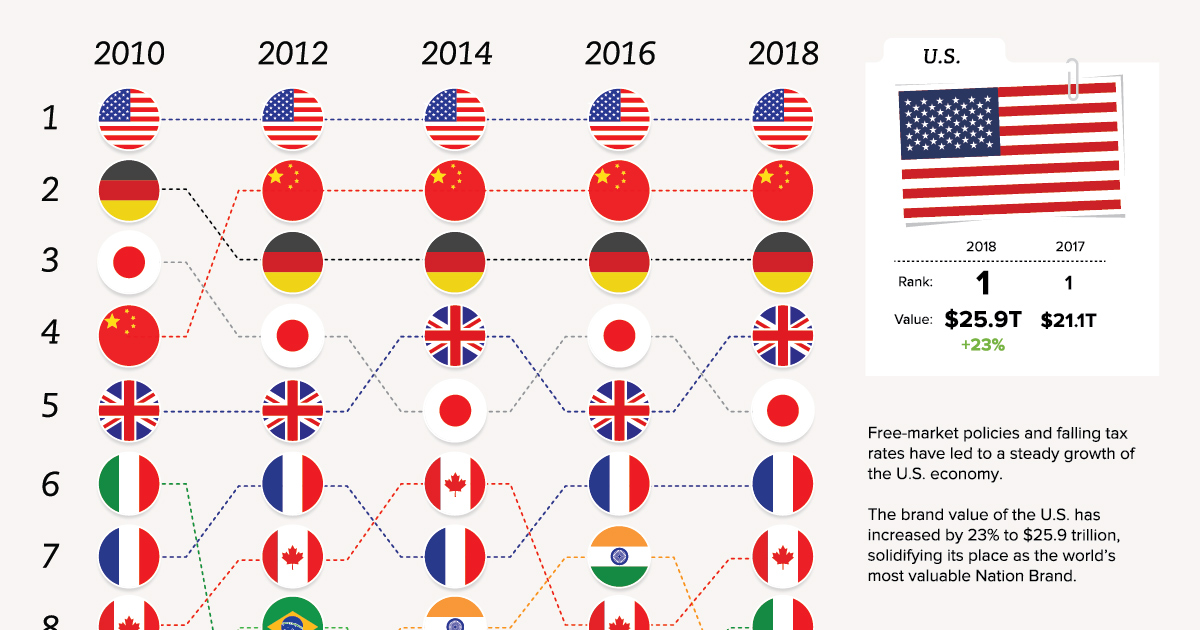
In a global marketplace, a country's national image can be one of its most valued assets or a challenging liability. See how nation brands do in...
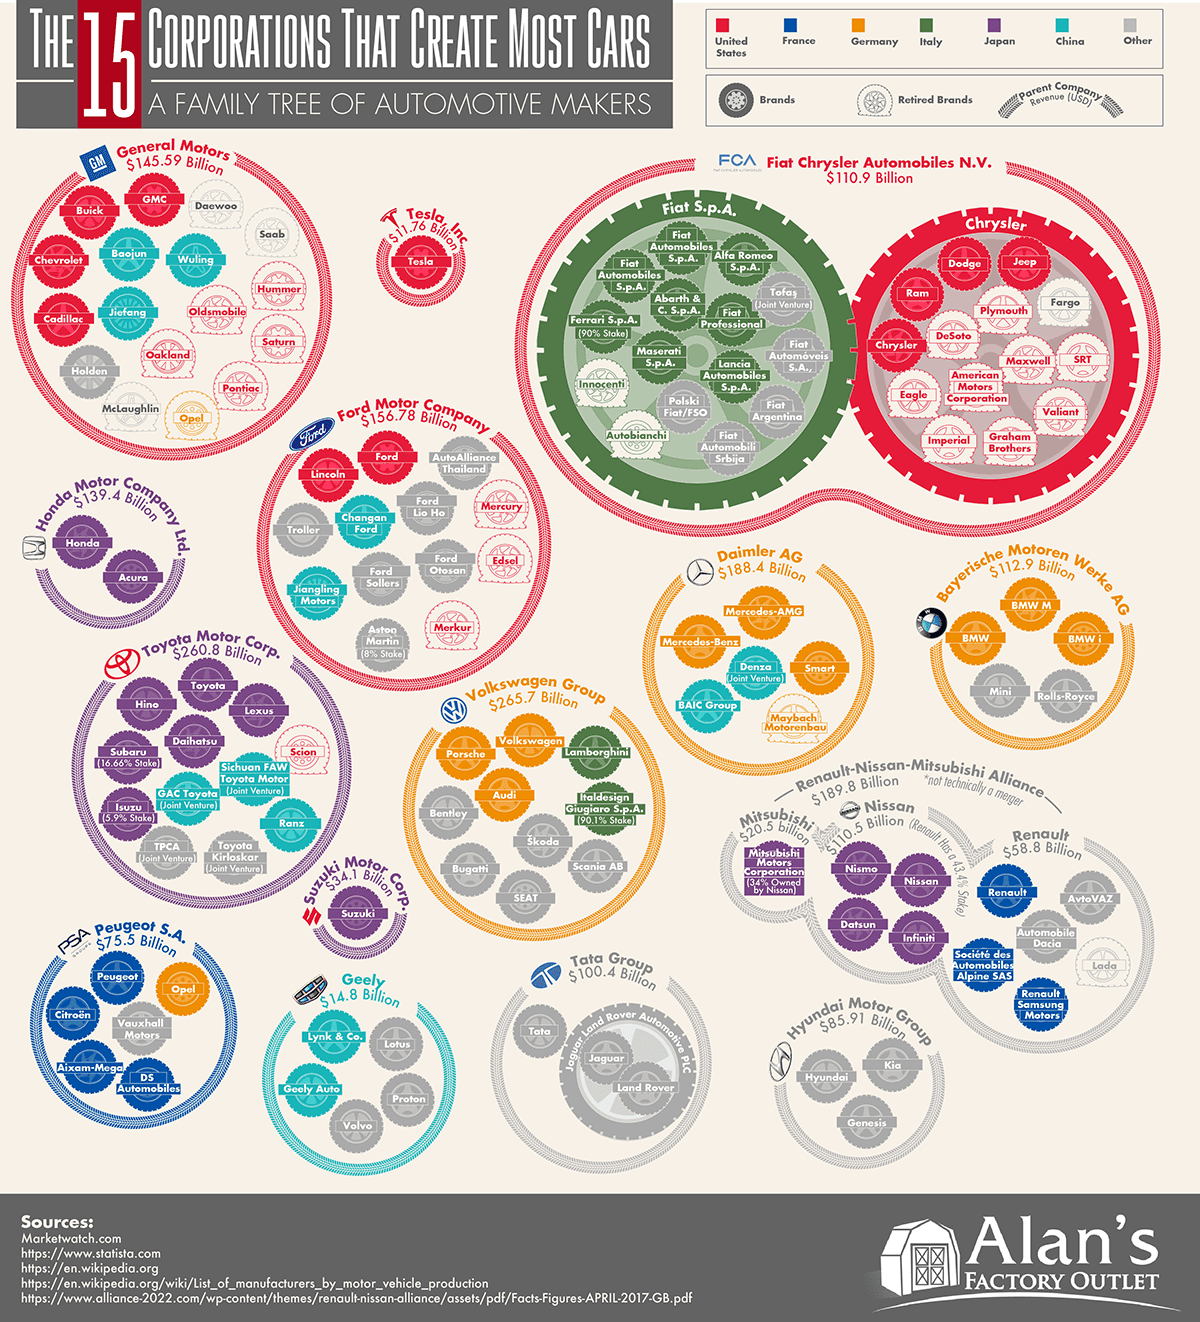
This massive infographic shows the 15 corporations that make the most cars, their annual revenues, and the brands owned by each automaker.
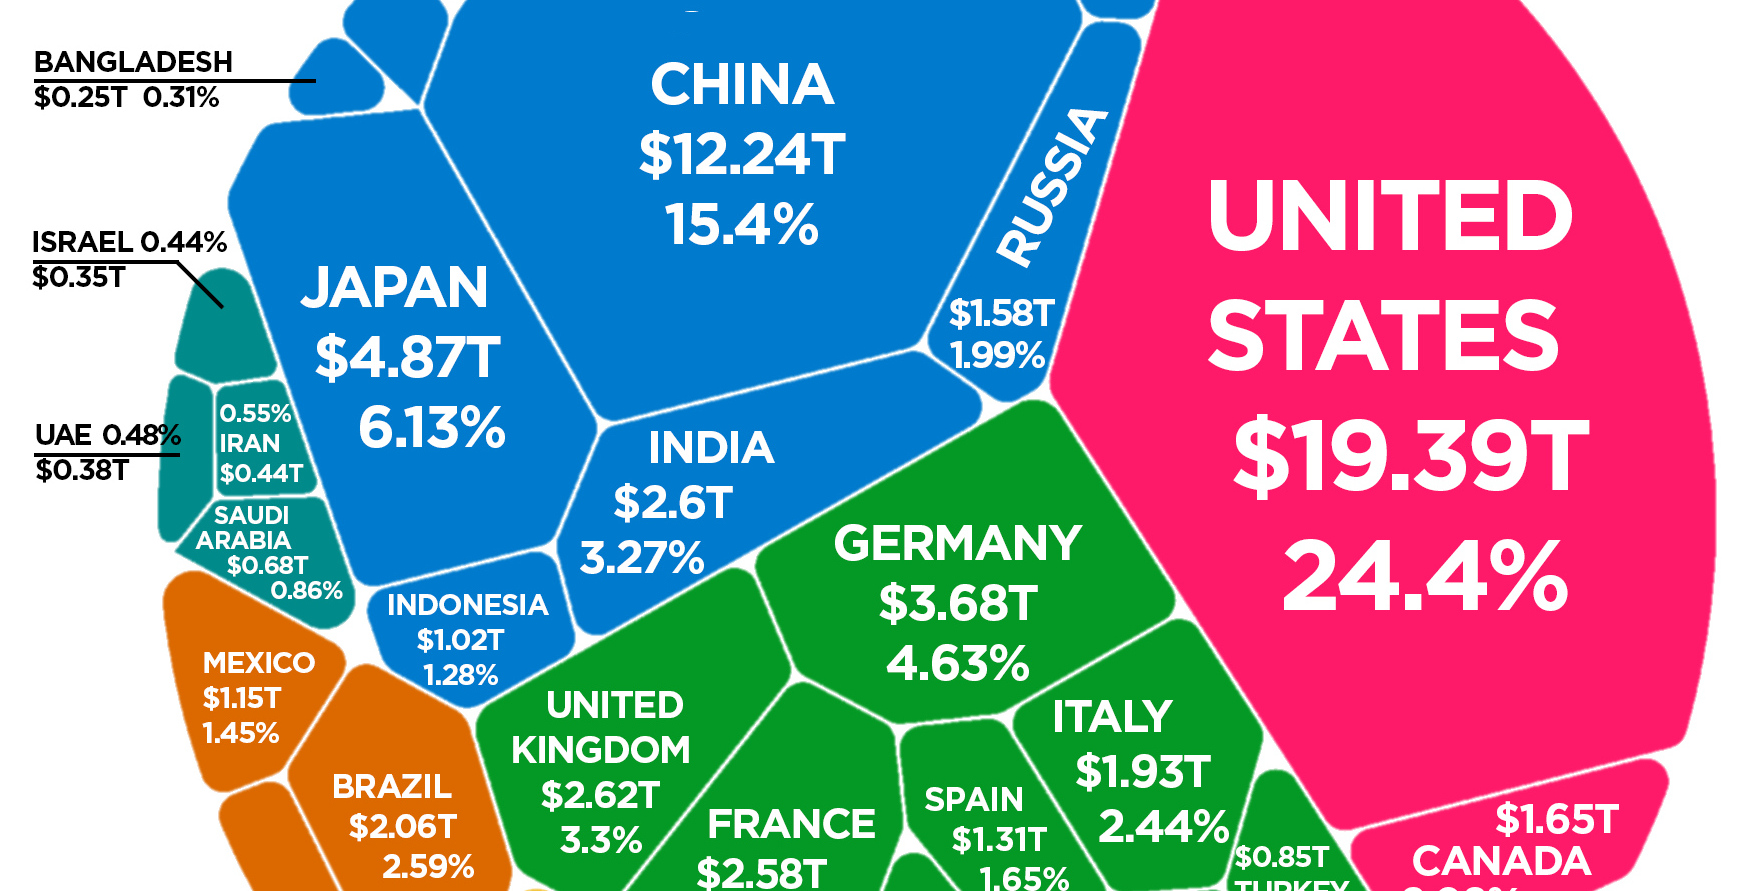
Latest estimates put the world economy at about $80 trillion in nominal GDP. Here is how each individual country stacks up in terms of size.
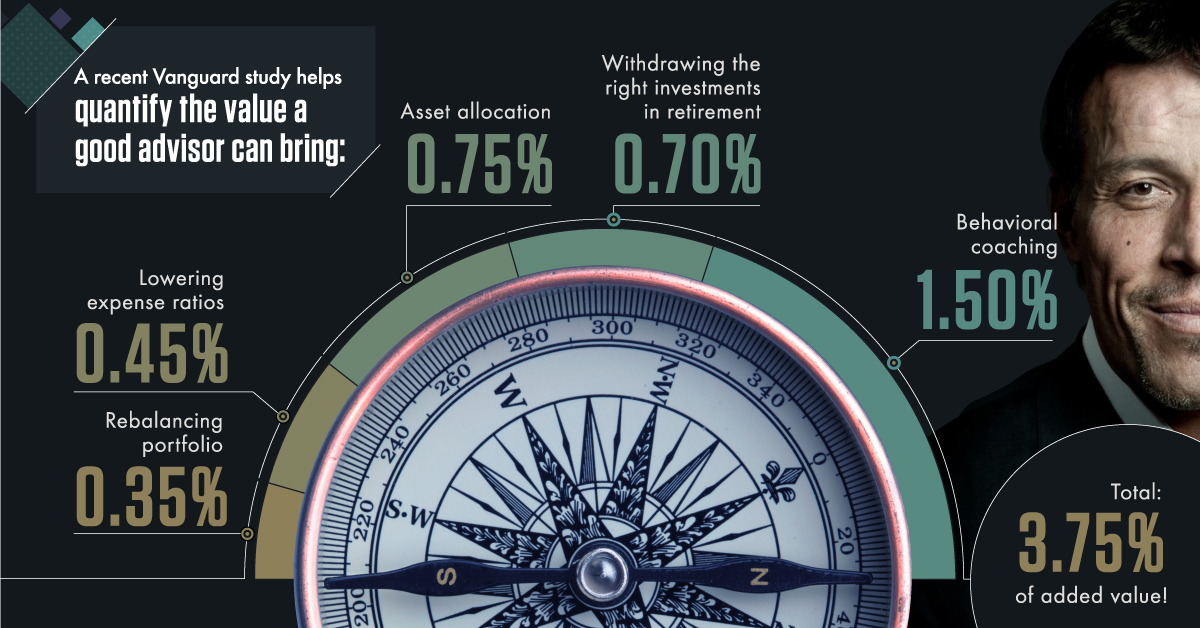
The right financial advisor can add up to 3.75% of value to your portfolio - but how do you find the right one that will serve...
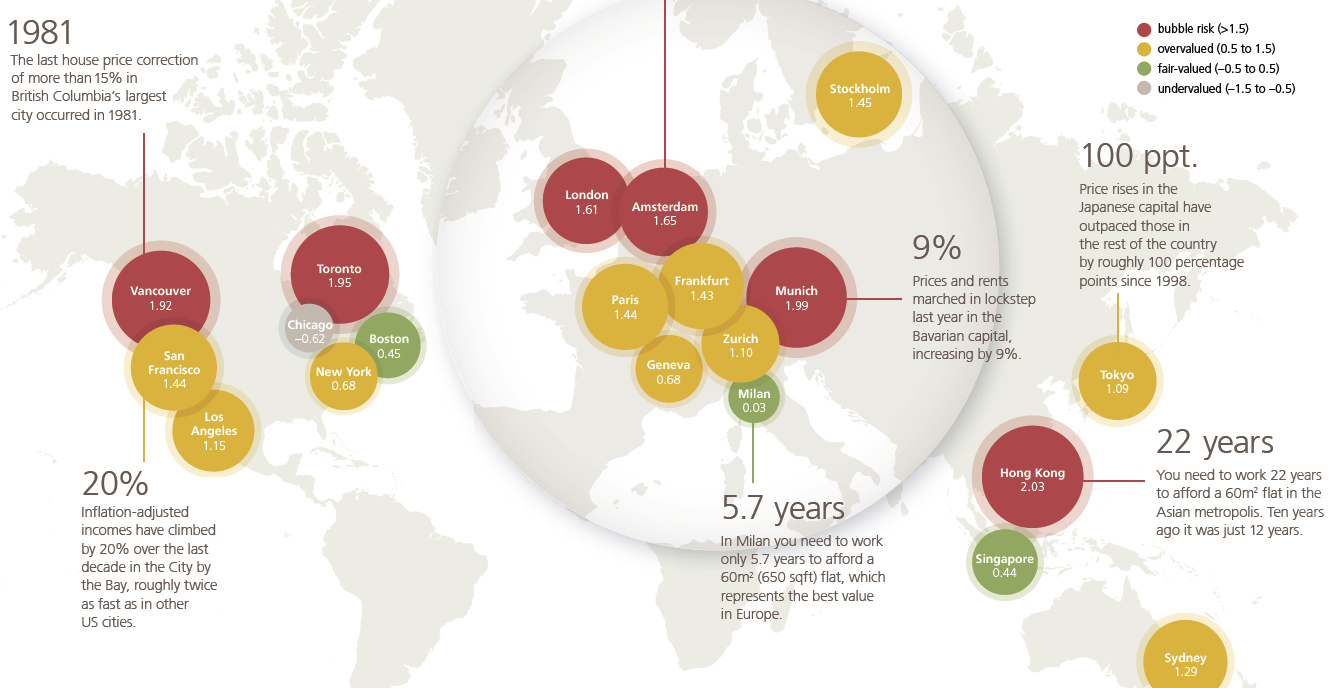
UBS says cracks are starting to show at the top end of the property market, according to the bank's recent analysis of the biggest real estate...
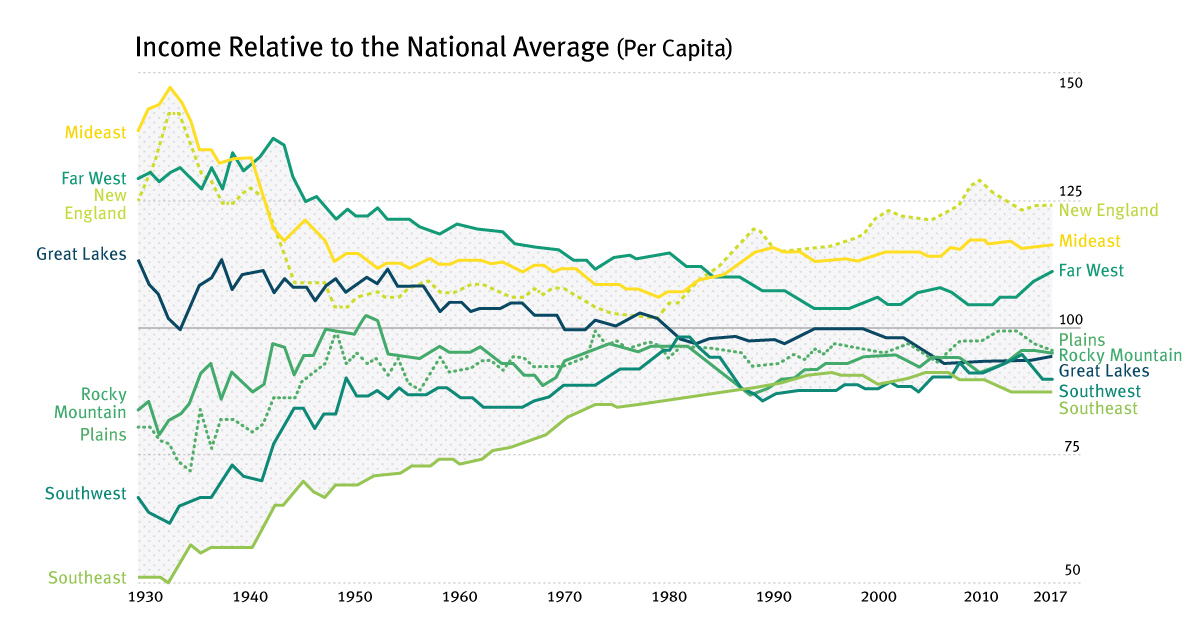
For most of the century, the geographical difference in per capita incomes has been narrowing - but it appears this trend has now reversed in the...
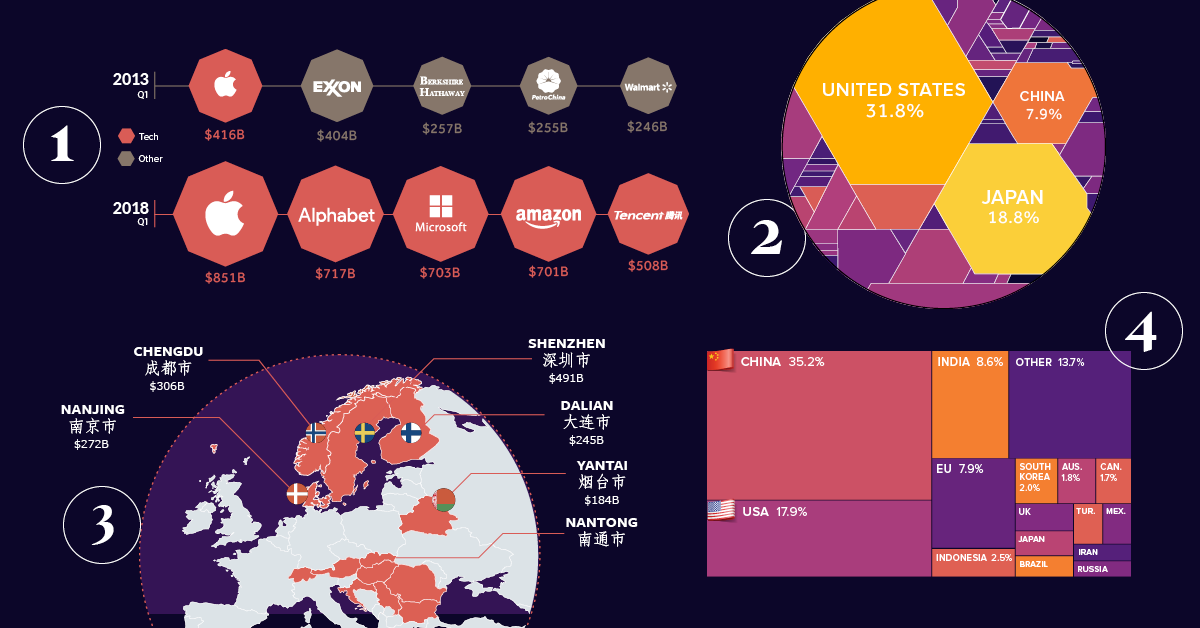
This special feature uses powerful charts and infographics to visualize the eight major forces that are shaping our global economy and the business landscape.
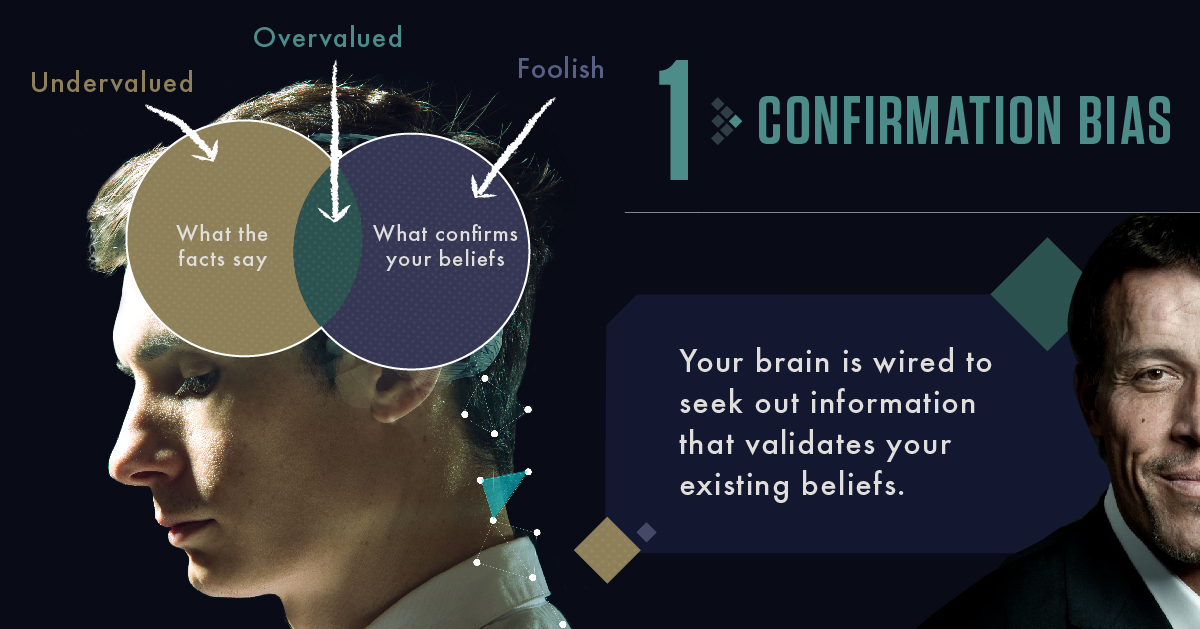
Our brain can be our own worst enemy. It's hardwired to avoid pain, and to seek pleasure - and these instincts can wreak havoc on your...
Which countries receive the most money from international tourism? Each country is resized on this map based on dollars coming in from travelers.
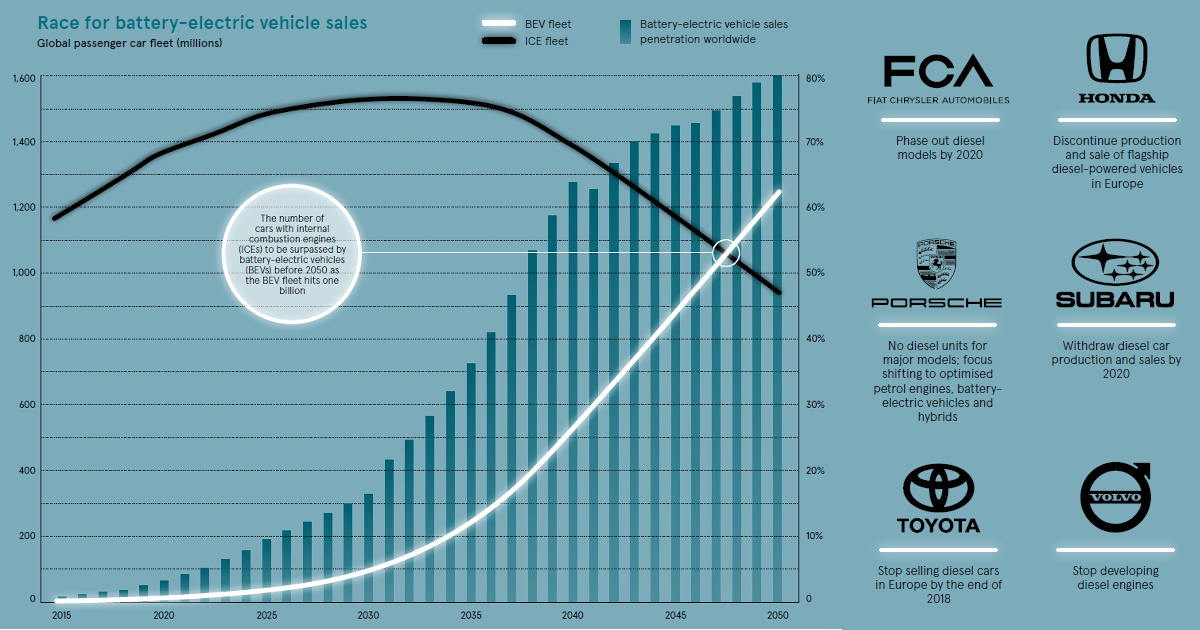
Electric vehicle sales will surpass those of traditional vehicles in 2038, and the global EV fleet will hit 1 billion vehicles by the year 2047.
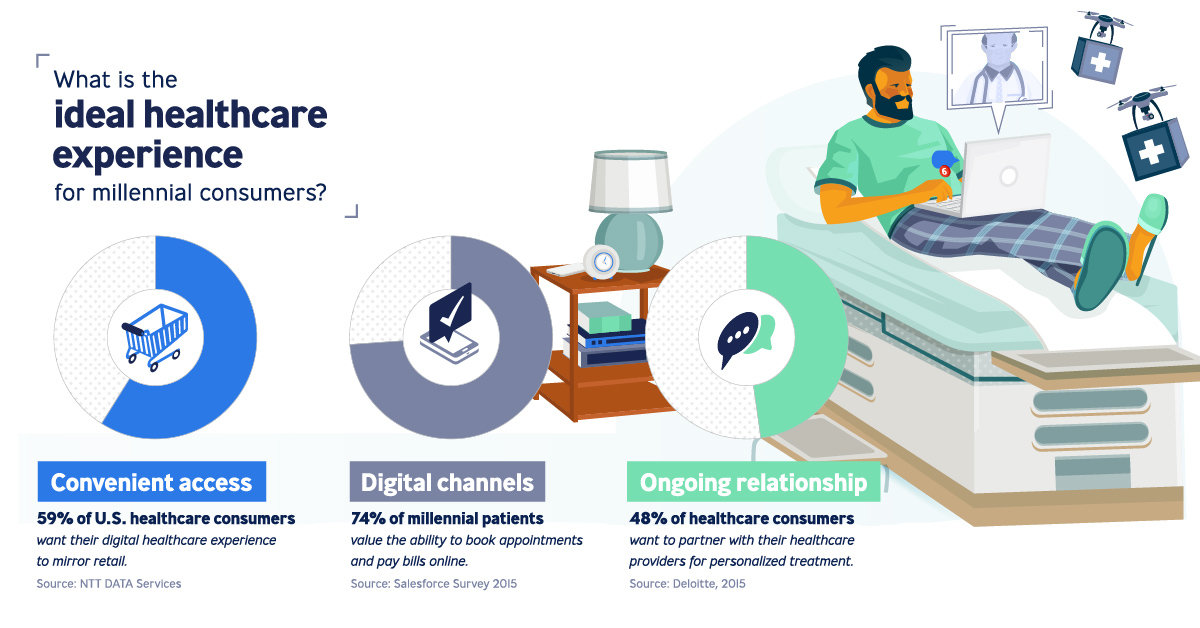
The healthcare industry is being transformed, unlocking a completely new patient experience that some are calling the 'Amazonification' of healthcare.
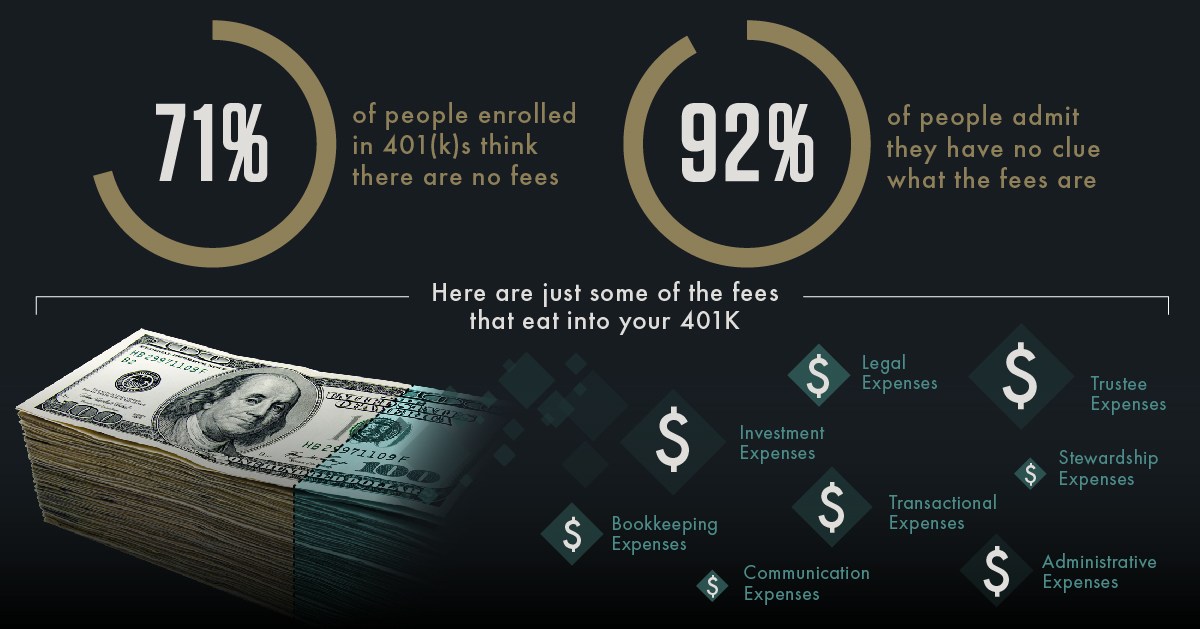
For most workers, a 401(k) plan is the most important tool for retirement saving - yet, 92% of Americans don't know about the massive fees they...
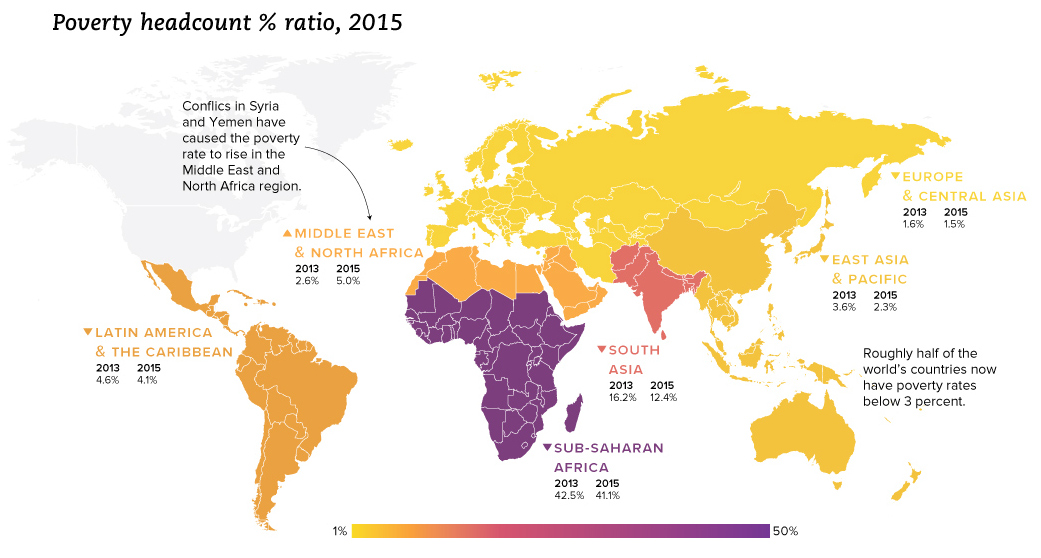
We look at the latest data from the World Bank, which reveals a drop in extreme poverty of 1 billion people globally since the year 1990.
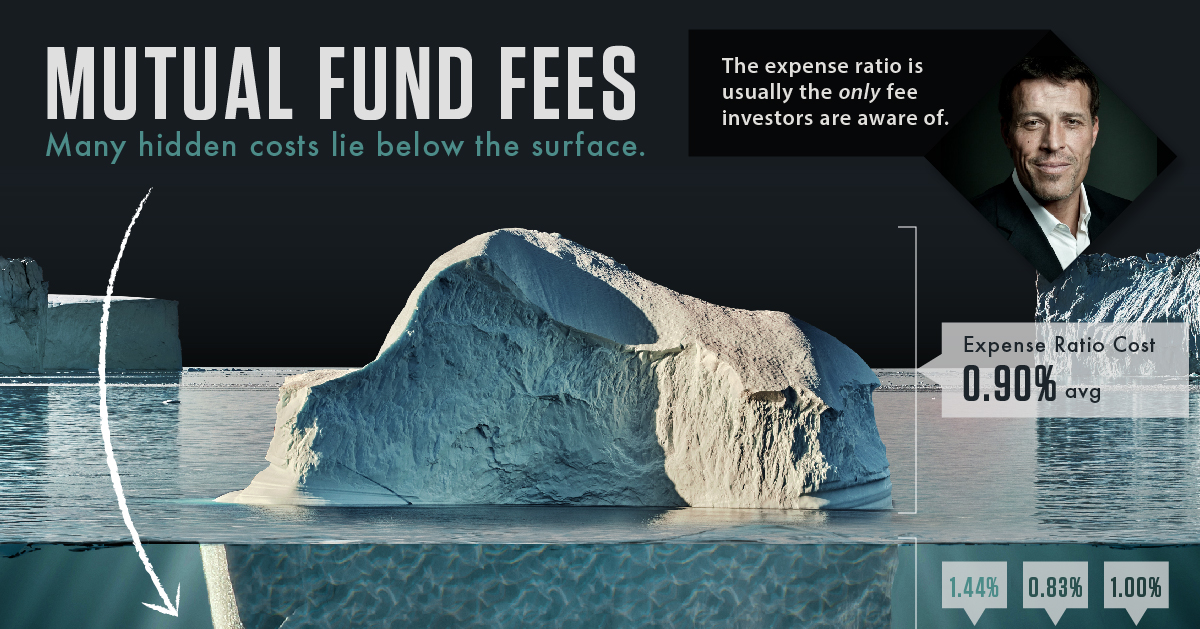
Fees are a silent killer that slowly erodes the value of a portfolio. Instead, it lines the pockets of brokers, fund managers, and big name Wall...
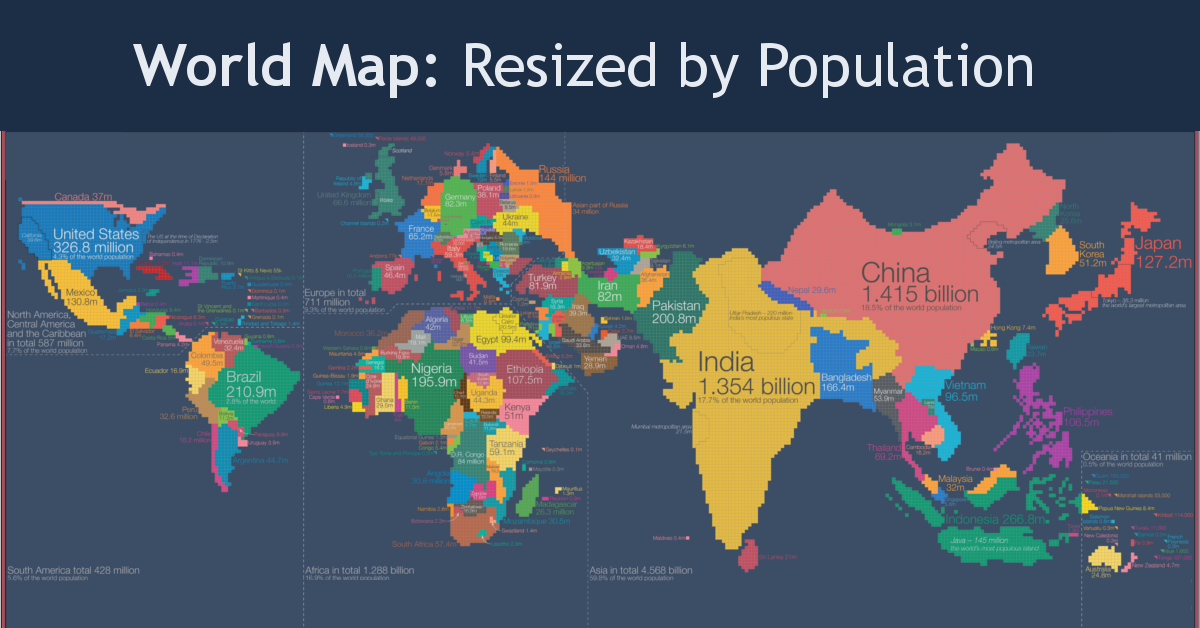
Look at global population in a whole new light, when countries on the world map are drawn based on population numbers instead of their usual borders.
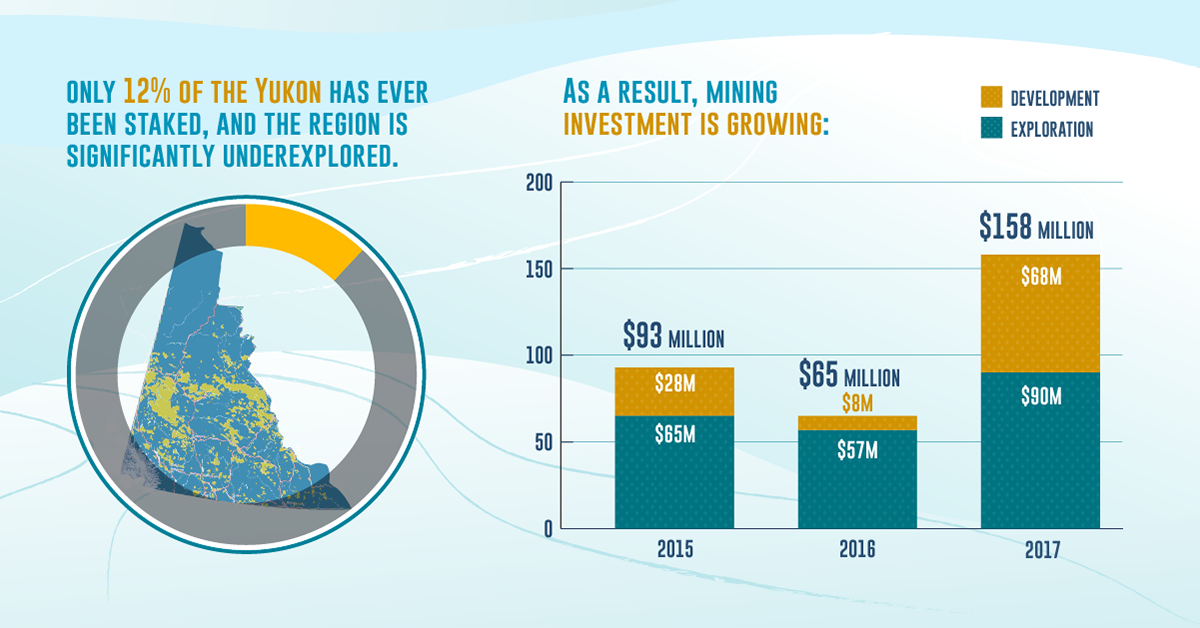
A rich history, untapped geological potential, and government support are just some of the reasons mining investors are looking at the Yukon.
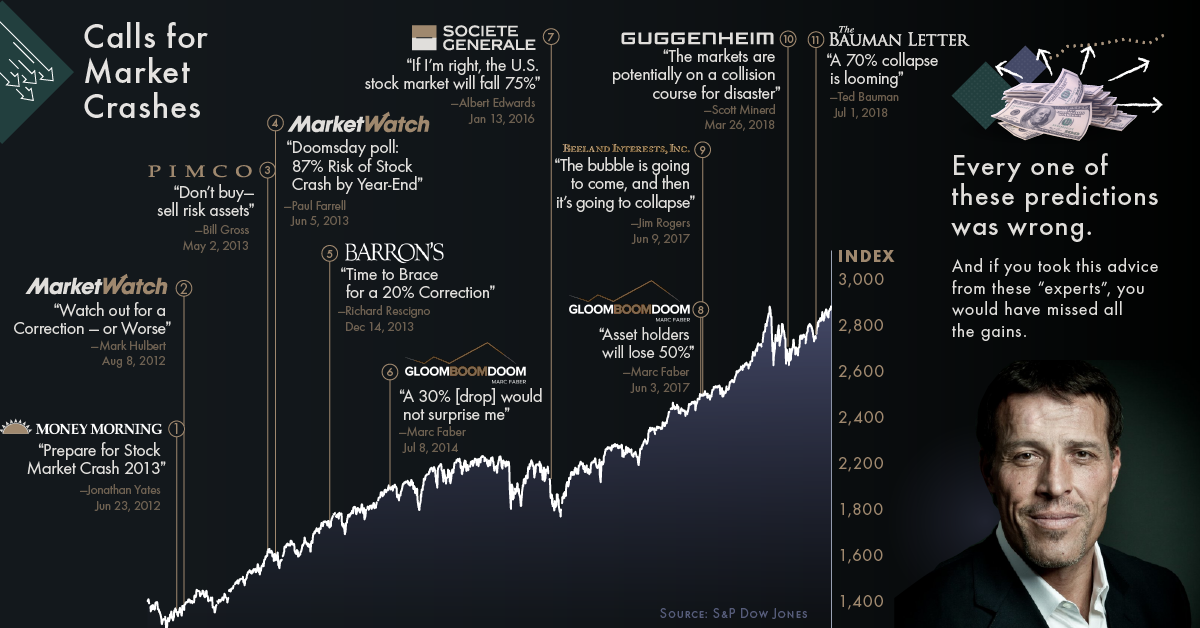
These key insights from the world’s top investors – like Ray Dalio and John Bogle – will free you from your fear of stock market crashes.
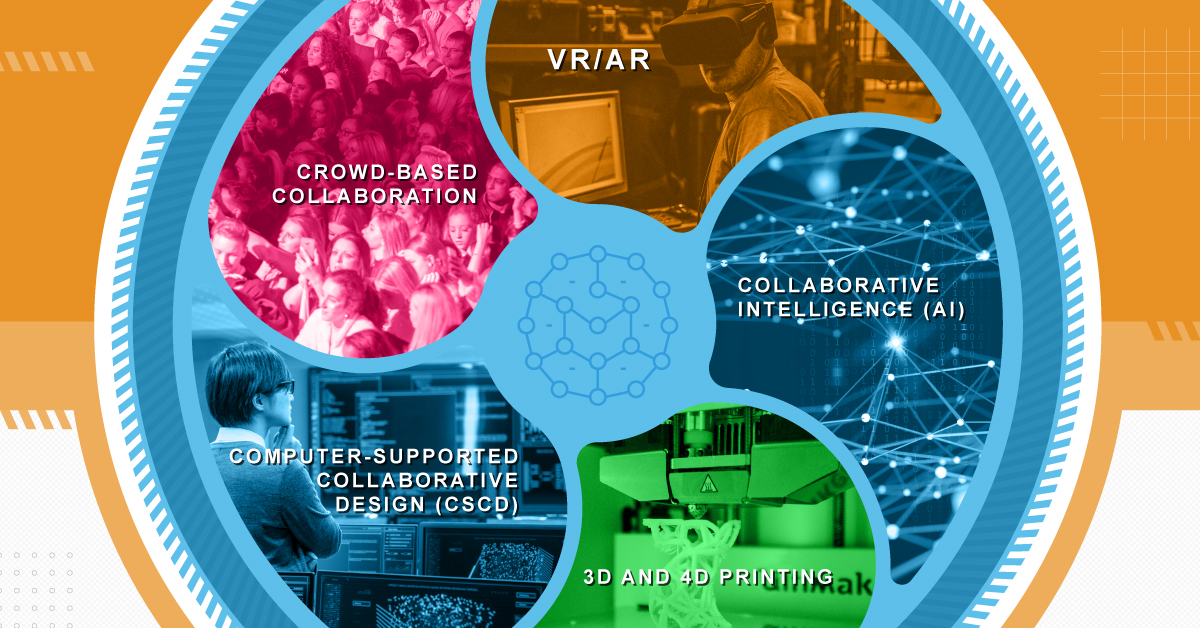
New tech is changing how we work together to make things, as well as how we work with machines. See how the future of collaboration will...
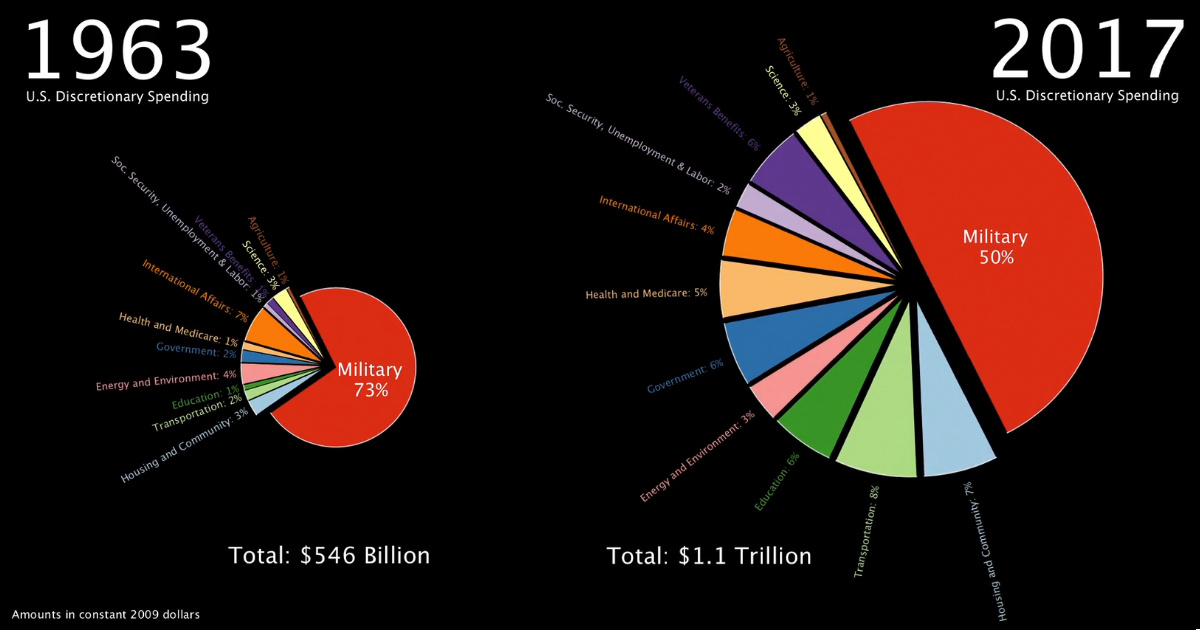
This stunning one minute animation breaks down U.S. government discretionary spending from 1963 all the way until today.
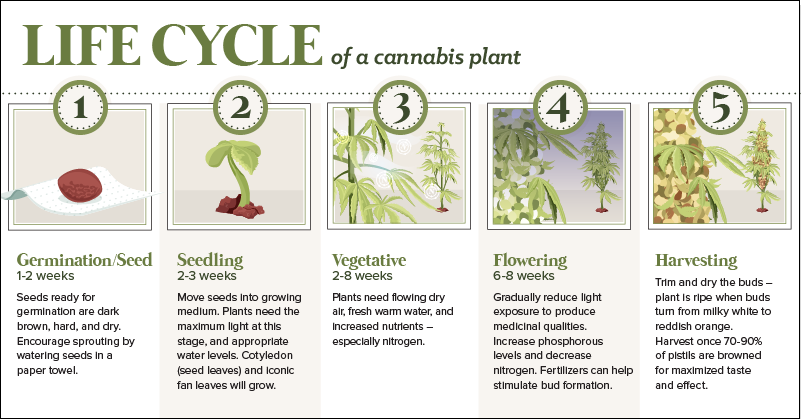
The North American cannabis industry is expected to be worth $47B by 2027. Here are the basics around the anatomy of a cannabis plant, and how...
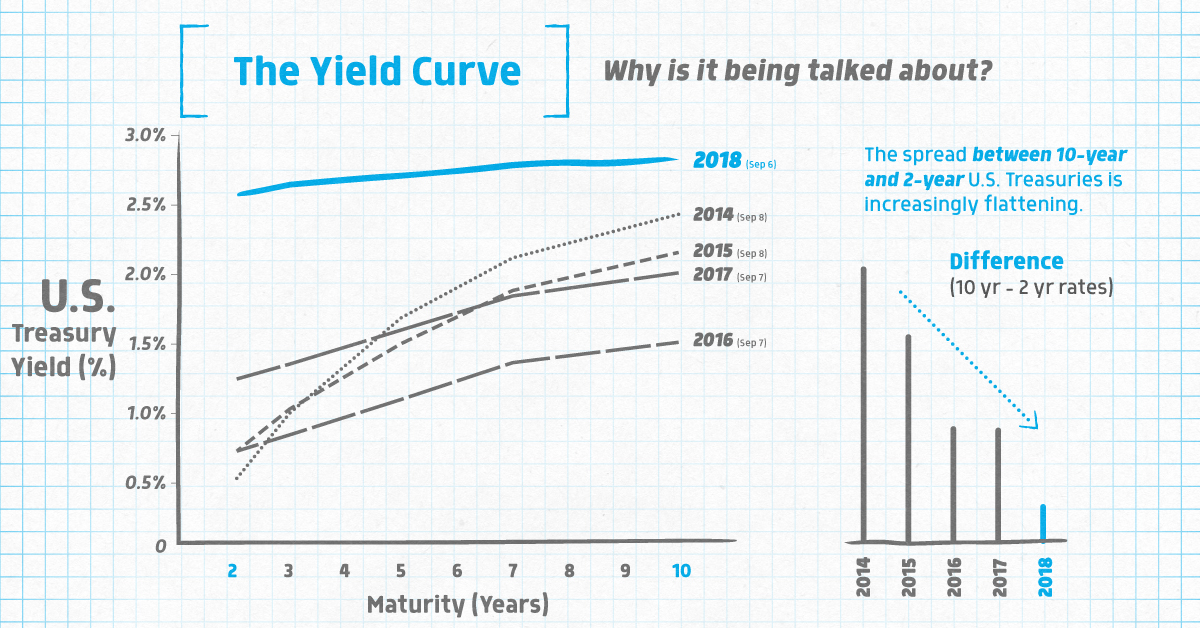
The financial world is abuzz about something called the yield curve - this infographic explains what it is, and why an inversion matters to markets.
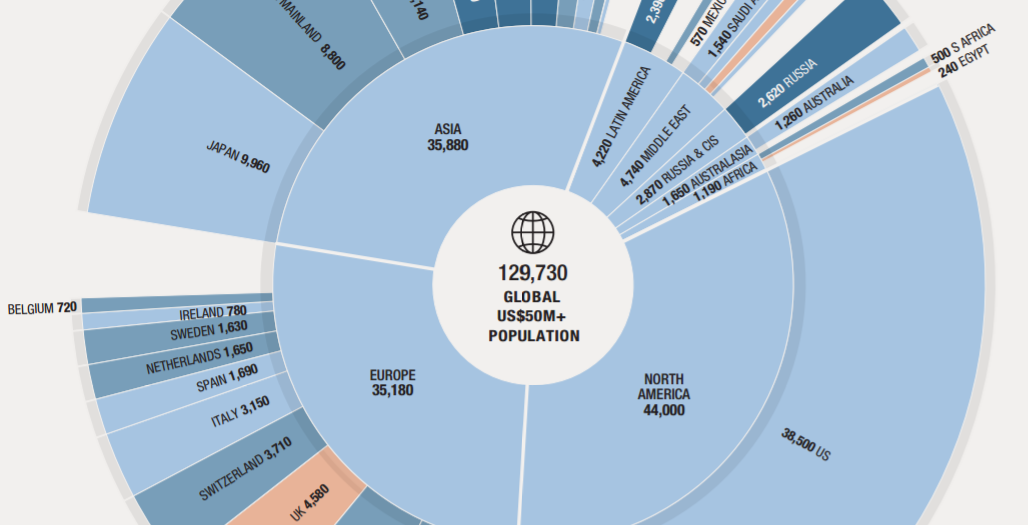
This nifty visualization from Knight Frank breaks down the world's population of ultra-wealthy ($50mm+) people by country and region.
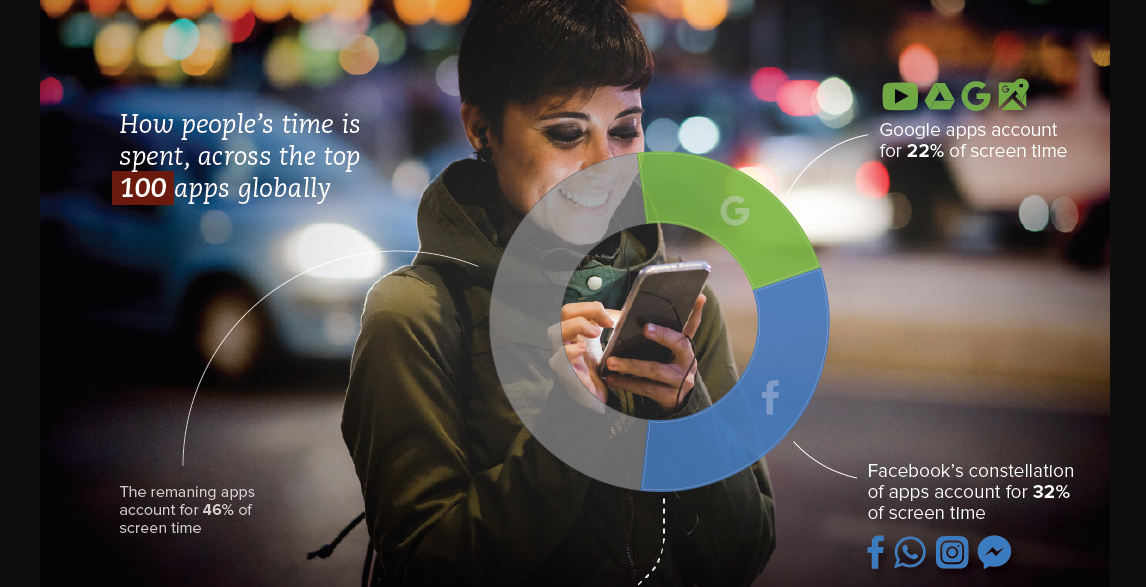
Facebook and Google owned apps capture 54% of all app screen time, out of the top 100 most popular apps around the world.
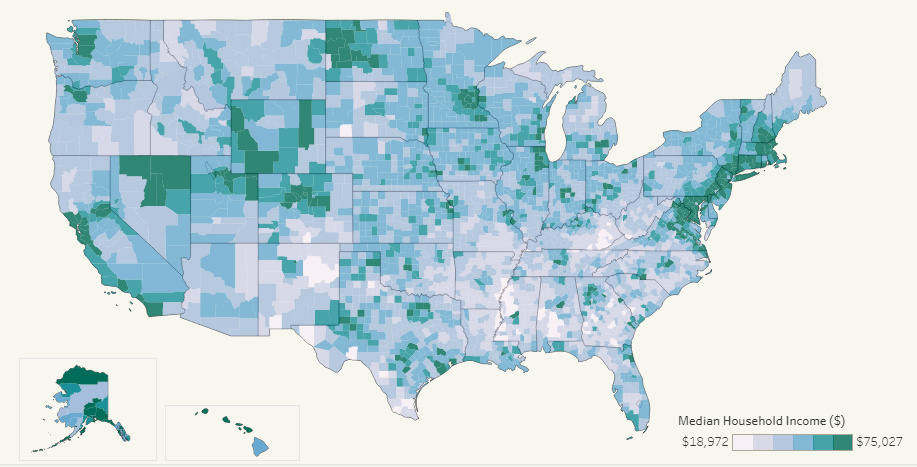
This interactive map allows you to pull data on median household income for all 3,000+ U.S. counties in existence, allowing for some interesting insights.
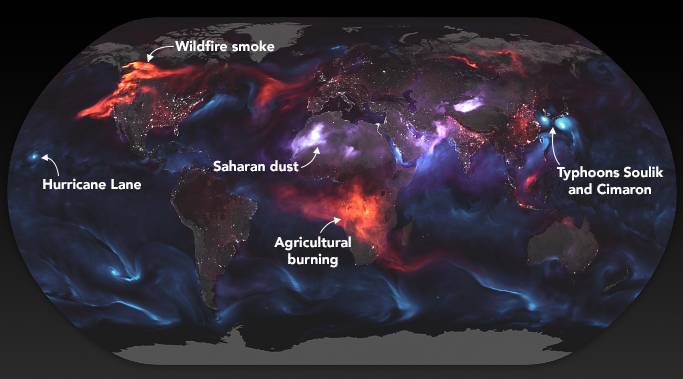
These stunning images from NASA give a whole new perspective on the massive wildfires engulfing the west coast of North America.
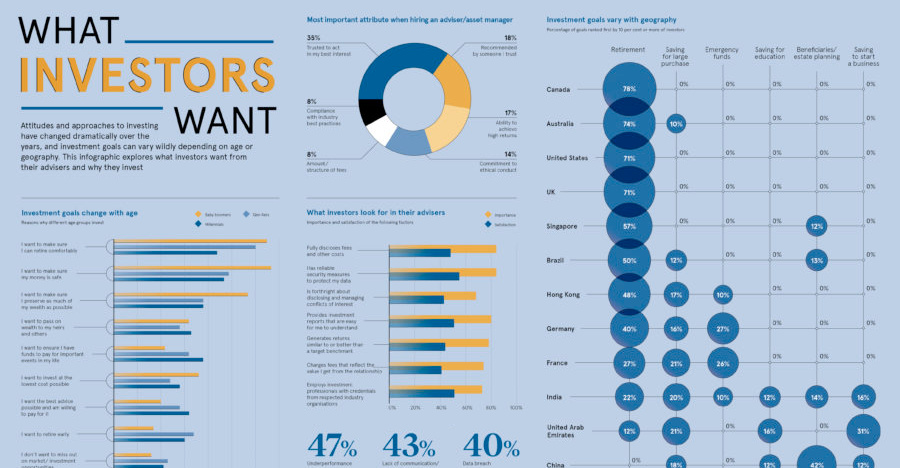
Are all investors saving for retirement, or do they have other investment goals in mind? Here's a look at goals sorted by geography and generation.
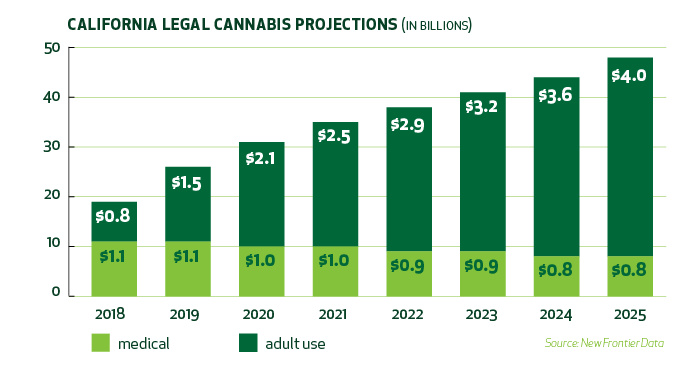
With 39 million people and the world's 5th largest economy, the California cannabis market has immense potential - that is, if companies can navigate it.
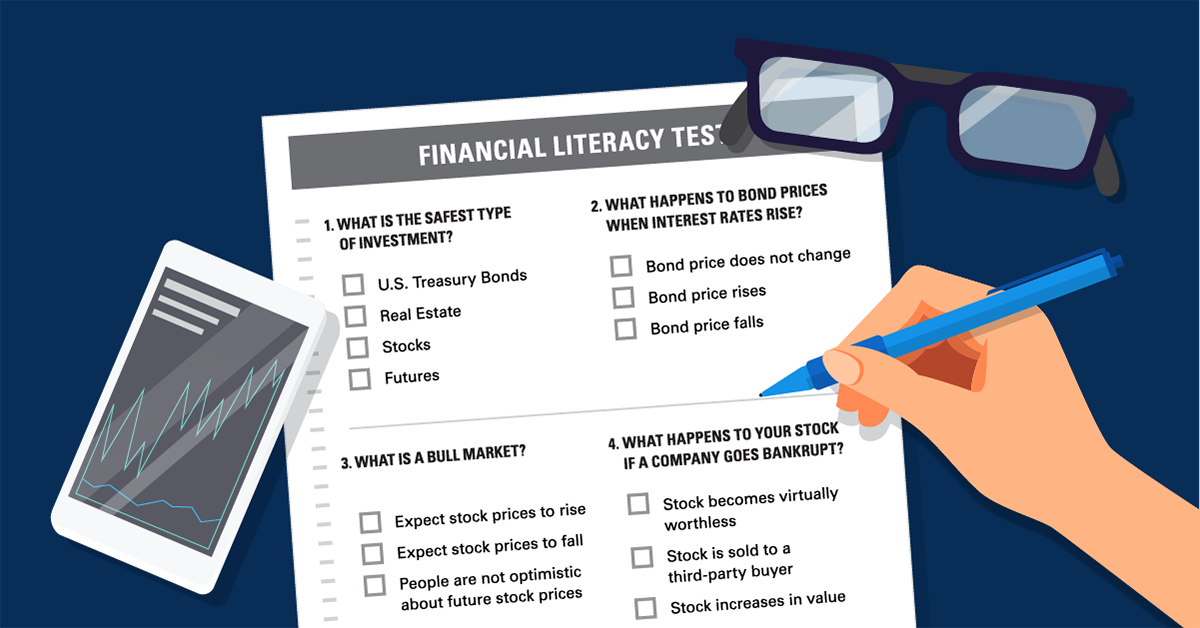
See how financially literate you are by answering this very short quiz. Can you get more than two questions right? (If so, you beat the average...
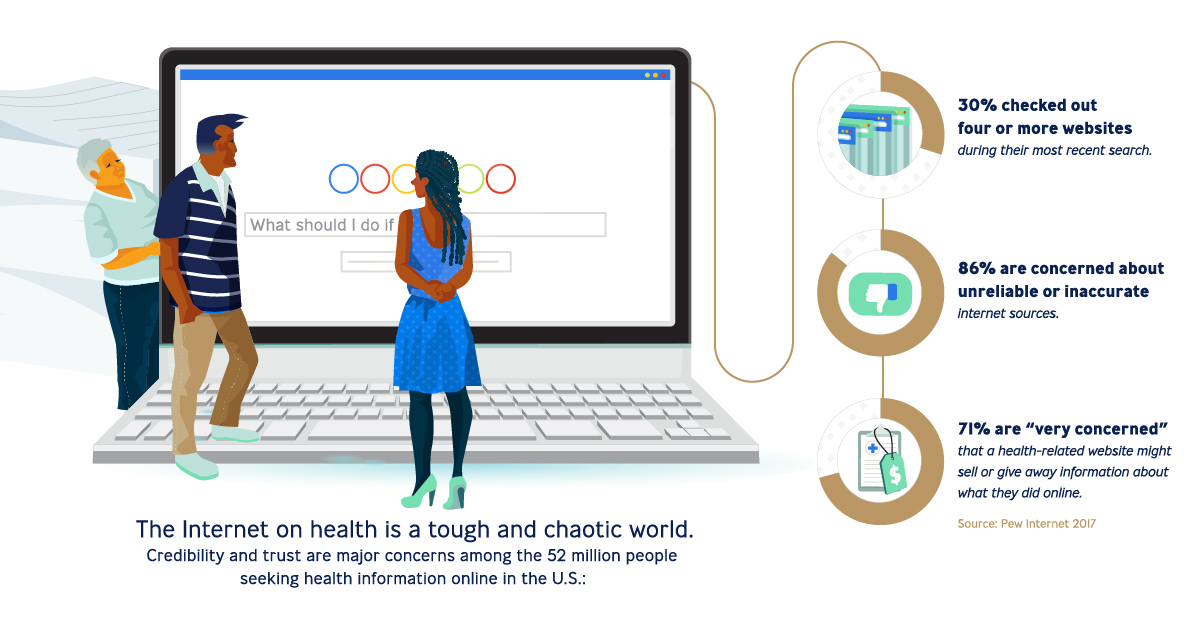
Technology has changed how consumers access health information - and if health companies don't pivot to a better content strategy, they will get left behind.
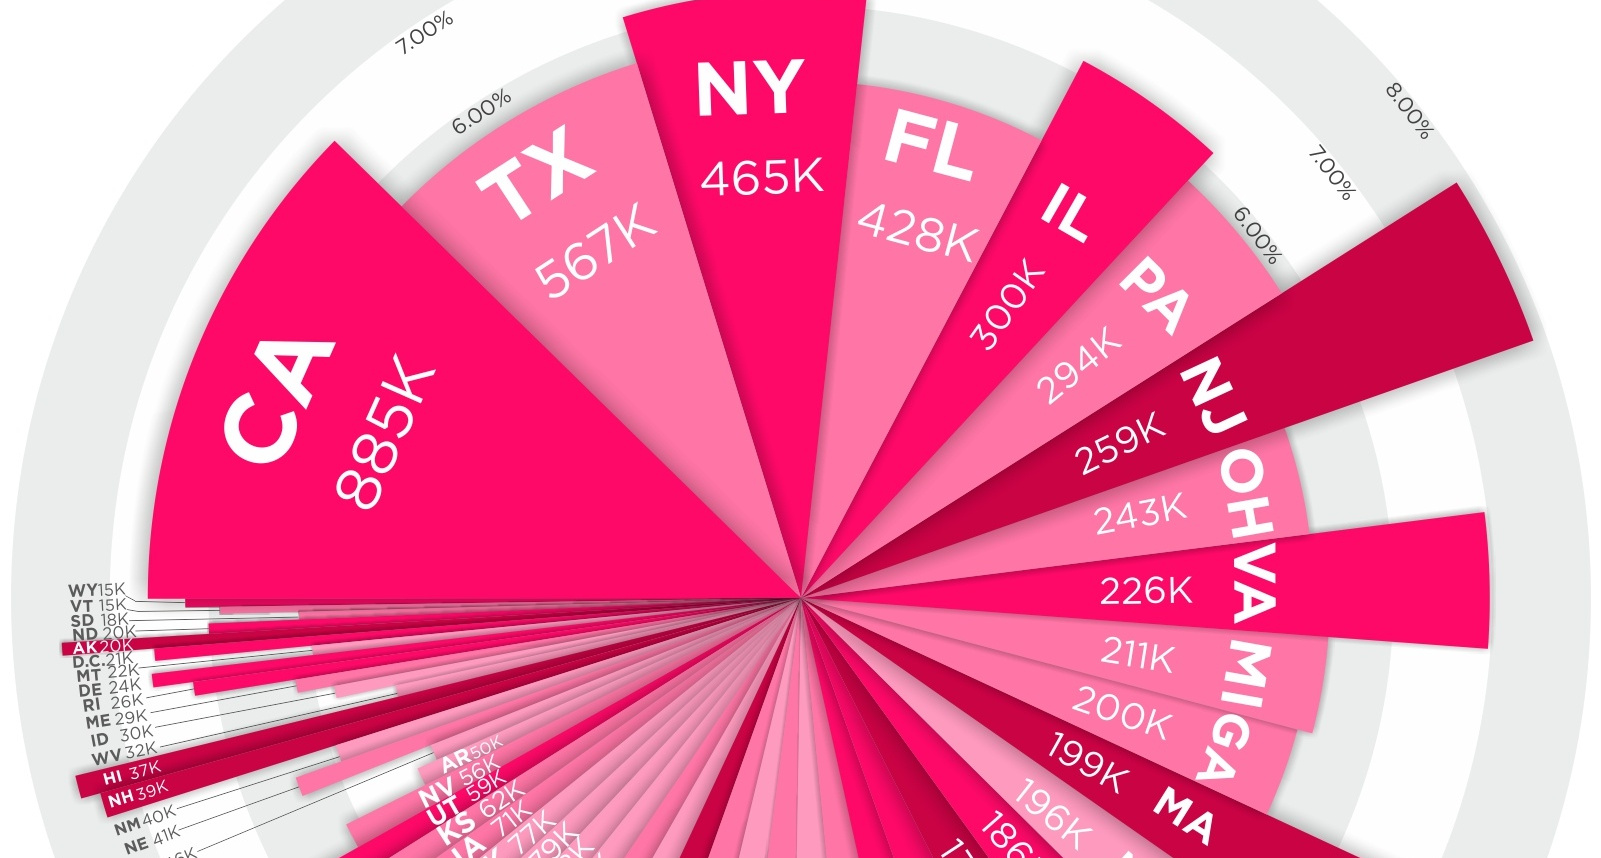
Where do millionaires live in the country? See millionaires by state - in terms of absolute numbers and percentage concentration - in this compelling visual.
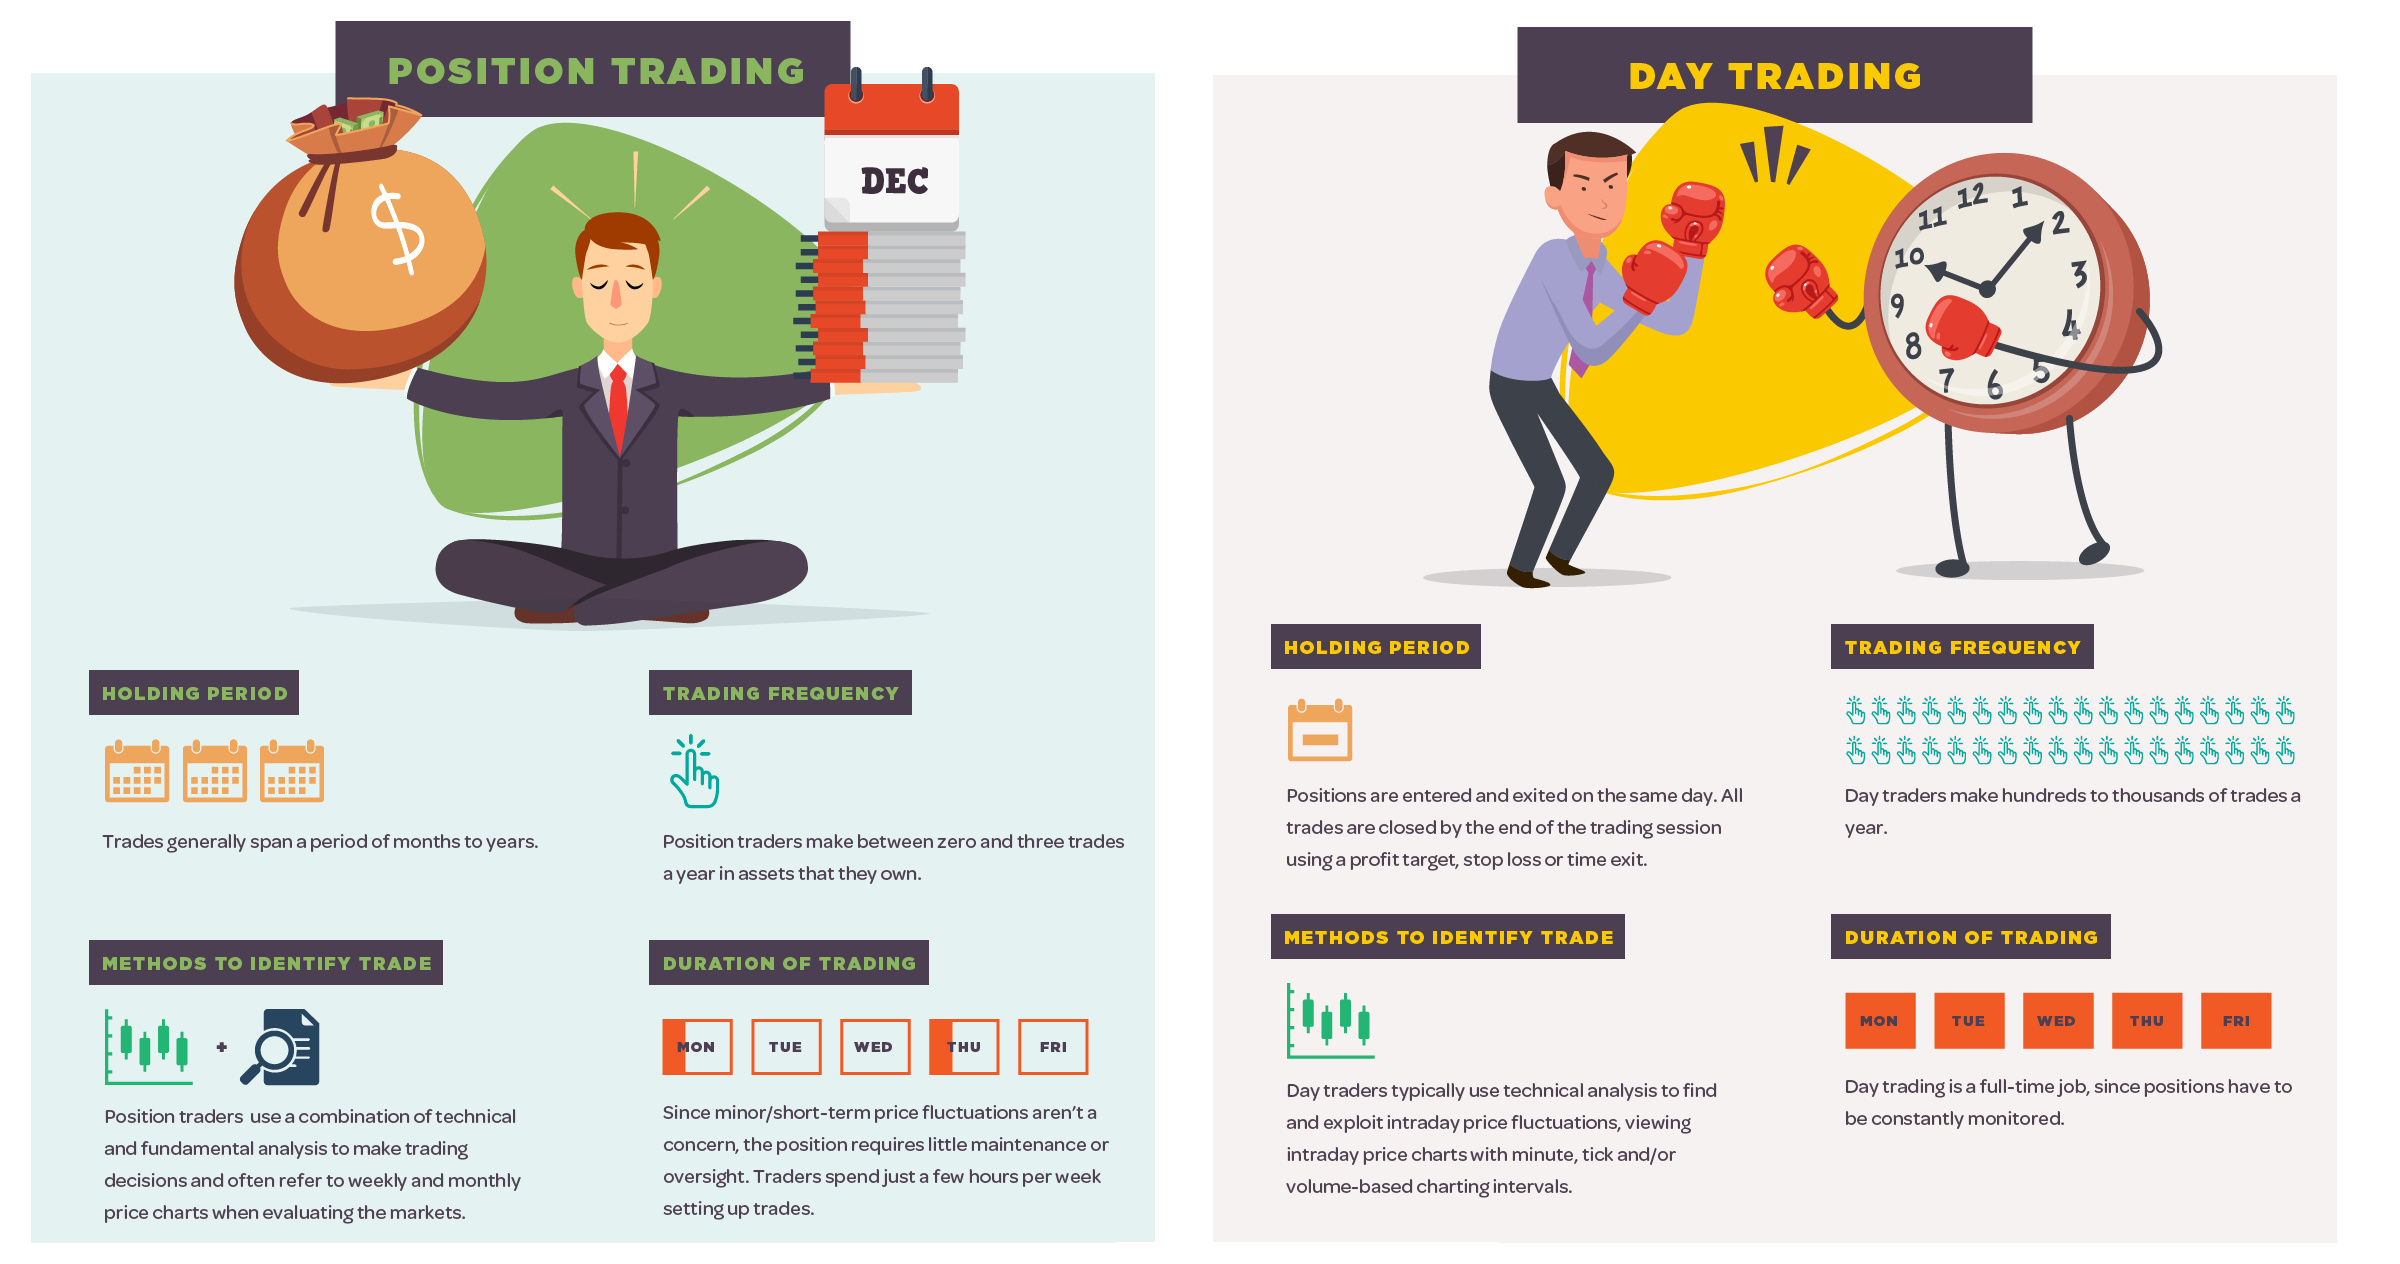
What are the major differences between the four main styles of trading stocks? See this handy infographic to find out.

As the legal cannabis industry emerges and evolves, we will demystify the business of cannabis including the plant itself, market segments, and industry trends.
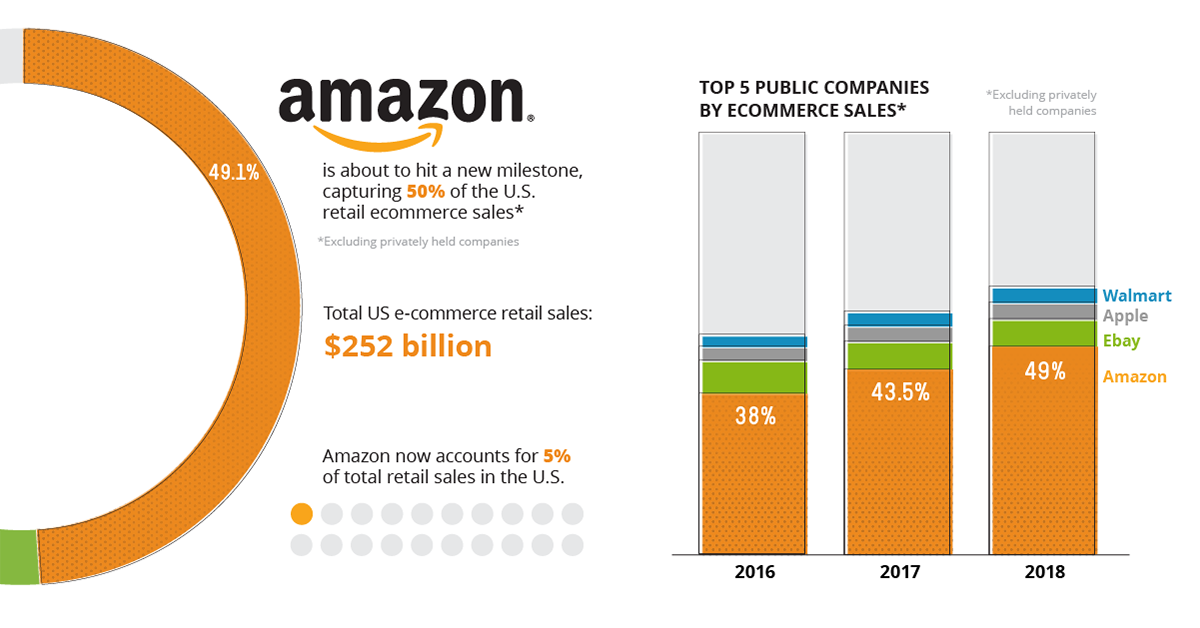
Amazon now accounts for nearly 50% of all U.S. ecommerce sales. This is more than double that of Amazon's next nine biggest competitors, combined.
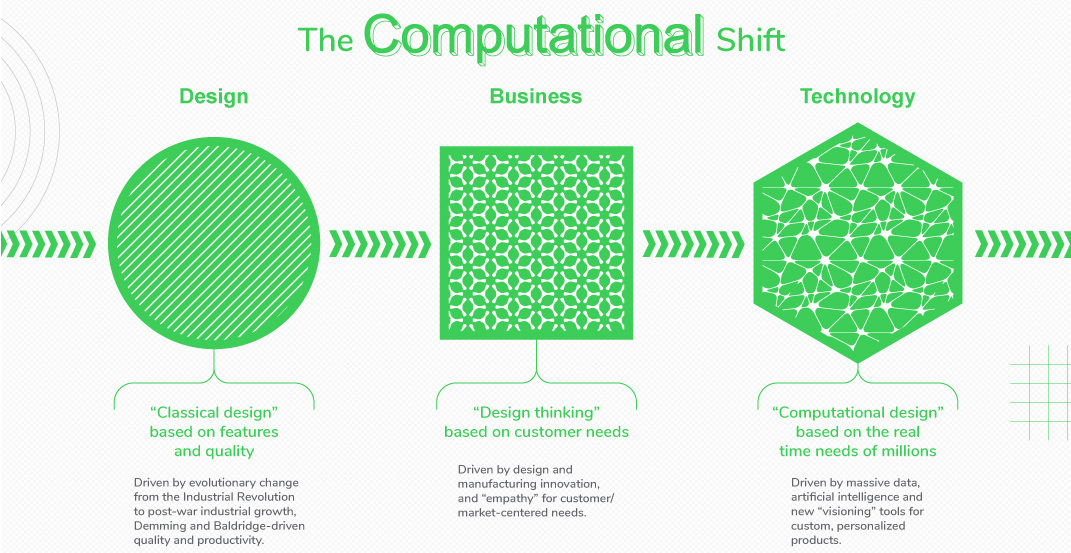
New tech is enabling an exciting but uncertain future for the design industry. See the forces shaping the future of design, and how these teams work...
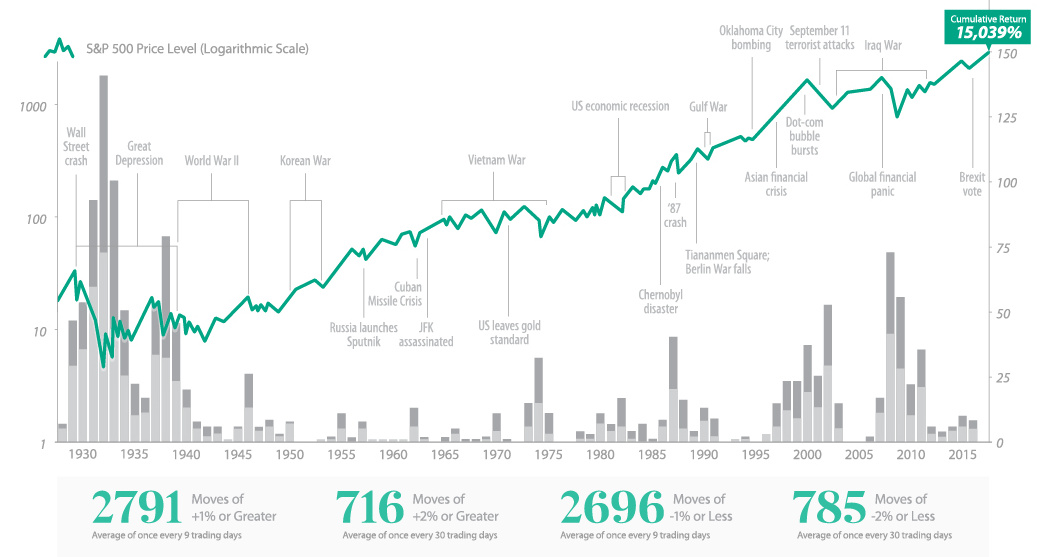
What is volatility, and how does it affect outcomes in the stock market? This intro to market volatility is a great primer for investors of any...
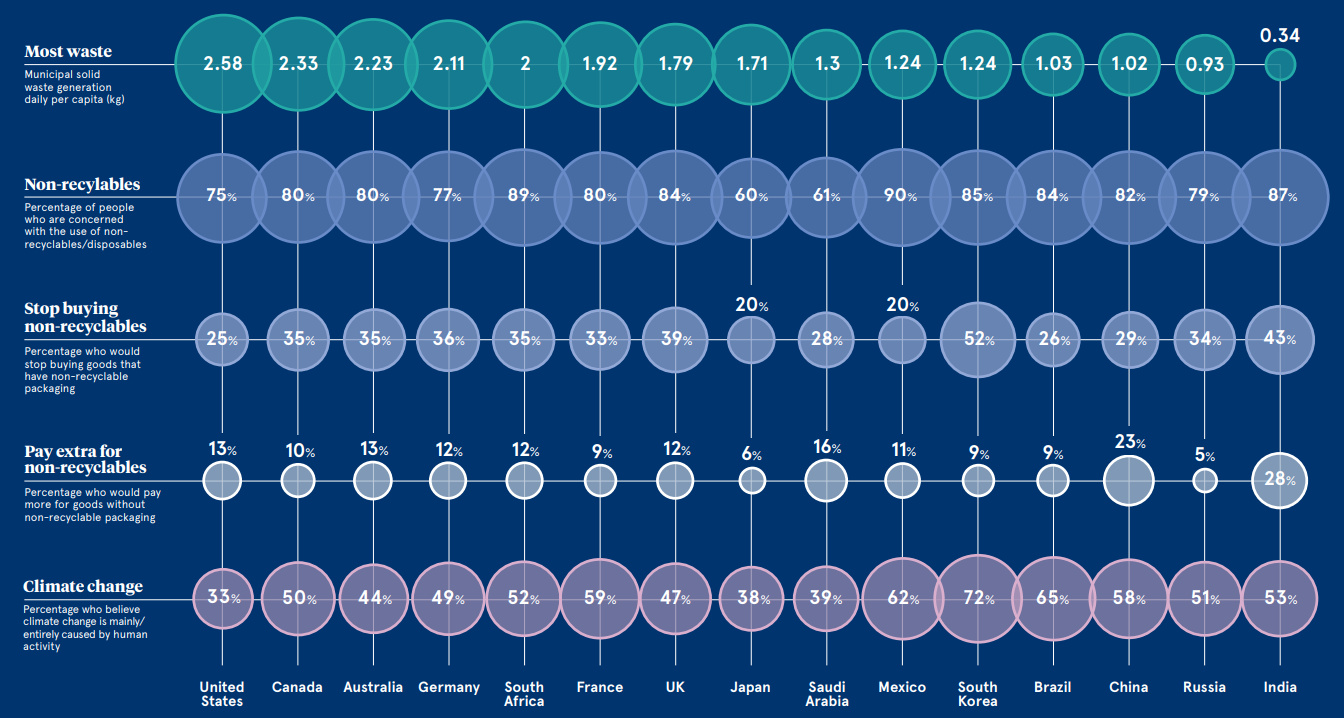
Summing up how different countries feel about waste, and how we can reduce it. Also, a look at global perceptions on the matter.

Google tracks pretty much everything you do, including where you've been, what you look like, and your personal beliefs. See what Google knows about you.
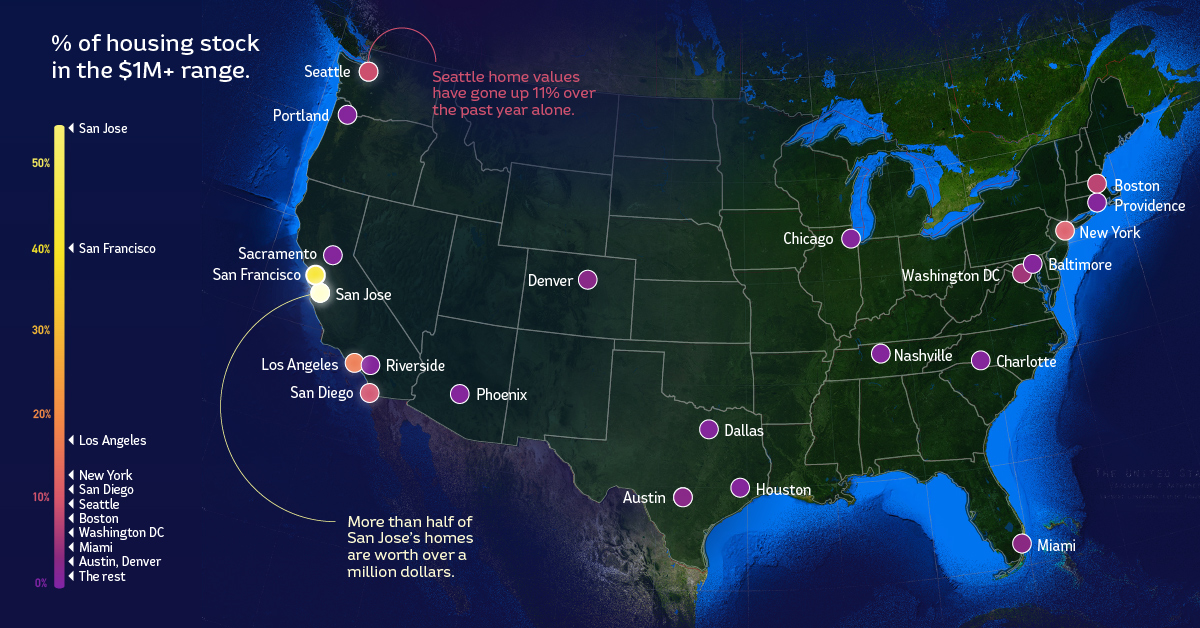
In most places, $1 million homes are a rarity. In California, things are a little different: San Jose, for example, has 53.8% of its homes exceeding...
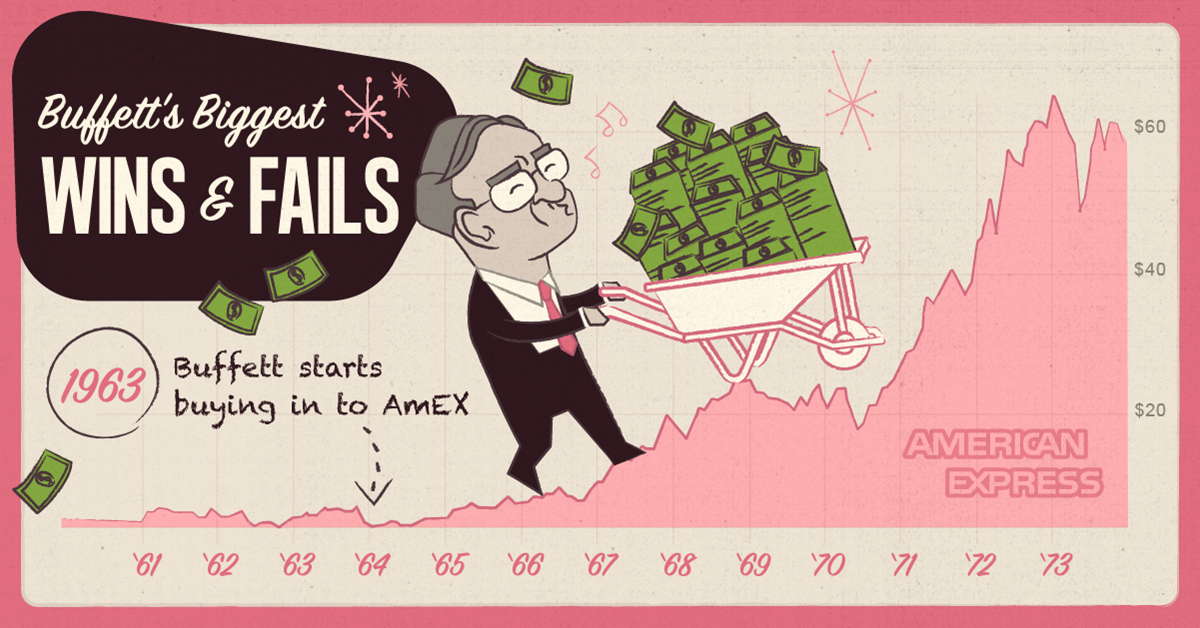
Counting down Warren Buffett's biggest wins and fails, including a mistake that the iconic investor estimates has costed him $200 billion to date.
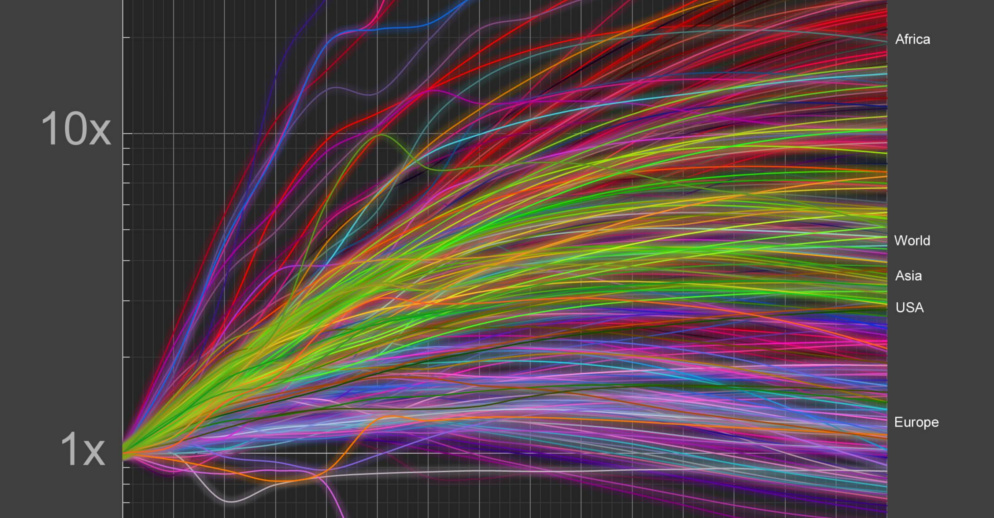
With every country's growth visualized on a logarithmic scale, we look at a few world population growth outliers and their unique stories.
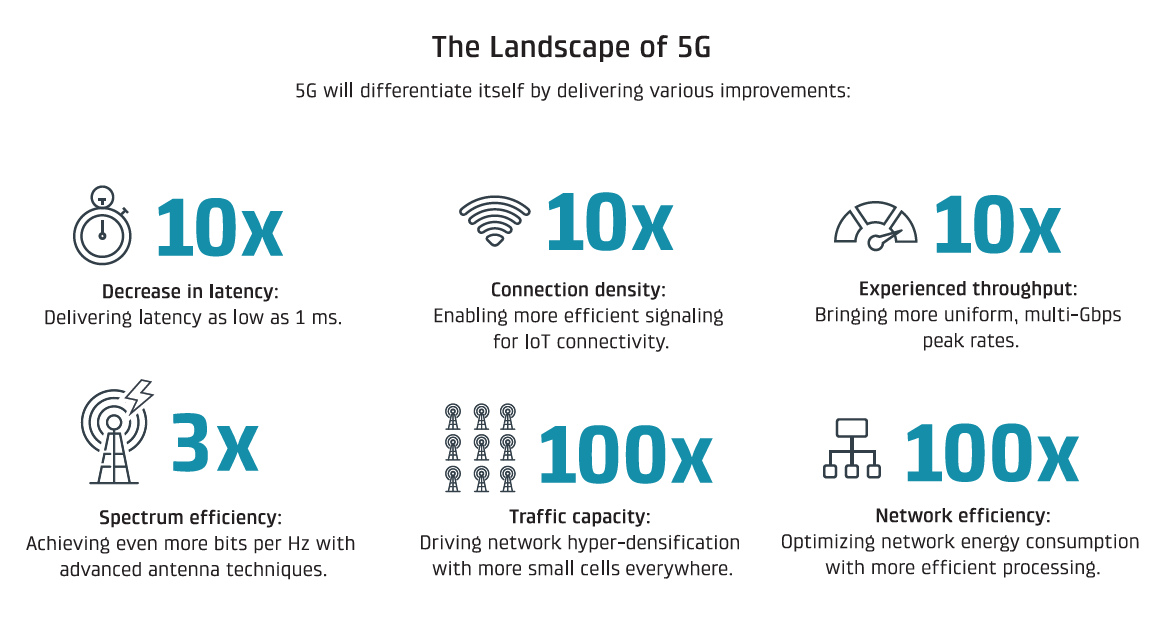
The next generation of mobile technology (5G) will completely change how we use devices such as smartphones, the IoT, and VR/AR tech.


