Markets
What Your 401(k) Provider Doesn’t Want You to Know
.container {
max-width: 1070px;
}
.button {
display: inline-block;
height: 45px;
color: #ffffff;
text-align: center;
font-family: helvetica;
letter-spacing: .01rem;
text-decoration: none;
white-space: nowrap;
border-radius: 0px;
line-height: 45px;
border: 1px;
font-size: em(13);
cursor: pointer;
box-sizing: border-box;
background: #464324;
transition-duration: 0.4s;
margin-bottom: 1px;
width: 16.6666%;
}
.button-group {
position: left;
width: 100%;
display: inline-block;
list-style: none;
padding: 0;
margin: 0;
/* IE hacks */
zoom: 1;
*display: inline;
}
.button-group li {
float: left;
padding: 0;
margin: 0;
}
.button-group .button {
display: inline-block;
box-sizing: border-box;
color: white;
}
.button-group > .button:not(:first-child):not(:last-child), .button-group li:not(:first-child):not(:last-child) .button {
border-radius: 0;
}
.button-group > .button:first-child, .button-group li:first-child .button {
margin-left: 0;
border-top-right-radius: 0;
border-bottom-right-radius: 0;
}
.button-group > .button:last-child, .button-group li:last-child > .button {
border-top-left-radius: 0;
border-bottom-left-radius: 0;
border-bottom-right-radius: 0;
}
.button:hover {
background-color: #8E8059;
}
.button.active {
background-color: #8E8059;
}
.button-group :not(:last-child) {
border-right: 1px solid white;
padding-right: 2px;
}
.button-group {
border-right: none;
margin-right: none;
}
@media (max-width: 600px) {
.button {
font-size: 13px;}
}

What Your 401(k) Provider Doesn’t Want You to Know
Born in 1984, the 401(k) plan gave regular Americans a way to make tax-deductible contributions to a retirement account directly from their paychecks.
Today, it’s the single most important investment vehicle for most people in the country:
- 90 million Americans participate in 401(k)s
- $6 trillion in assets are invested in 401(k)s
- 51% of employers match a portion of employee 401(k) contributions
The only problem? With trillions of dollars at stake, financial firms have scrambled to get their hands in as many 401(k) cookie jars as possible.
And today, the vast majority of plans are characterized by huge commissions, expensively managed funds, and layer upon layer of additional – and often hidden – charges.
Flying Below the Radar
Today’s infographic is from Tony Robbins, and it uses data and talking points from his #1 Best Selling book Unshakeable: Your Financial Freedom Playbook, which is now available on paperback.
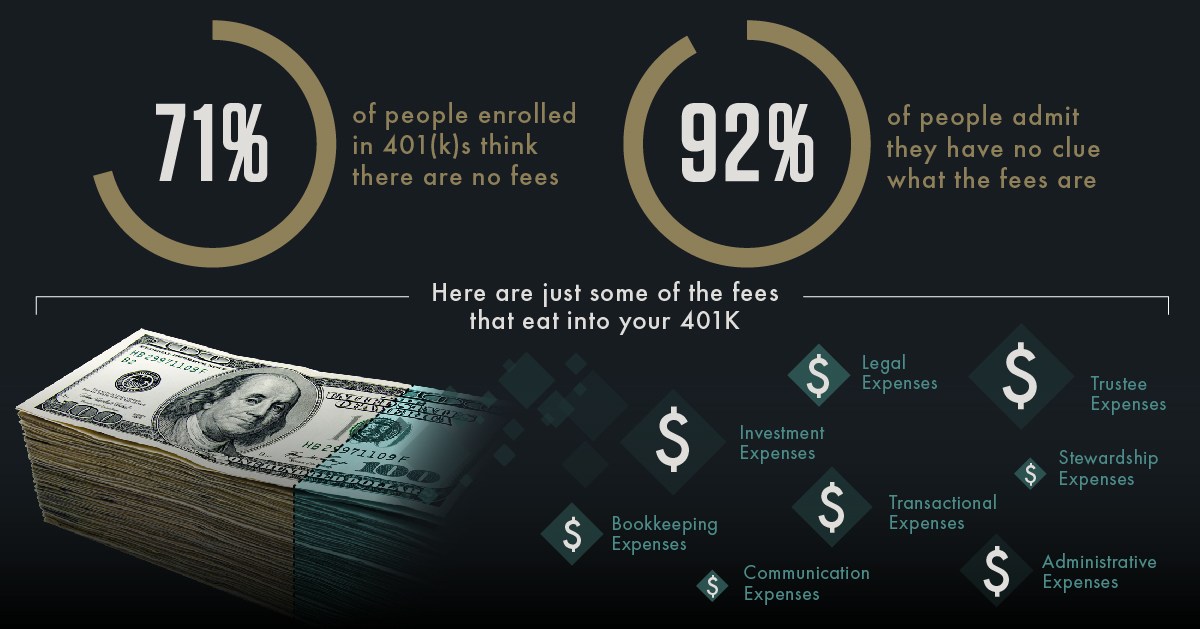
It reveals that although 401(k) plans can be used as crucial vehicles for tax-free retirement saving, 92% of investors admit that they do not have any clue about the fees associated with their plan.
Further, 71% of people enrolled in 401(k)s incorrectly think that there are no fees at all.
The Retirement Savings Drain
Many people are unaware of the types of fees that get loaded onto 401(k) plans – and here are just some of them that get passed to the investor:
- Investment expenses
- Communication expenses
- Bookkeeping expenses
- Administrative expenses
- Trustee expenses
- Legal expenses
- Transactional expenses
- Stewardship expenses
How much does this all end up costing?
According to a thinktank report from Robert Hiltonsmith, the additional 401(k) fees can cut down the size of your retirement nest egg by an average of 30% for an average worker earning $30,000 per year (and saving 5%), this ends up being $154,794 over his or her lifetime.
For someone making $90,000 per year, it works out to a whopping $277,000 in 401(k) fees.
Paying to Play
Hidden fees are bad, but this next practice is potentially even worse.
It turns out that most big-name 401(k) providers accept payments from the mutual funds they offer on their plans, as a part of revenue sharing agreements. In other words, many of the funds you get to choose from are not there based on merit – instead, they were the ones that coughed up the money to be there.
Not surprisingly, these tend to be actively managed, expensive funds – some of which even charge a “front-end load” fee of 3% to even buy into.
Why are there so few options to choose from?
- 93% of 401(k) plans carry under $5 million in total plan assets
- These are the small and medium-sized companies that make up most of the economy
- However, they also have the lowest buying power to demand better options for their employees
As a result, most providers offer limited options to their smaller, less lucrative accounts – and the low fee options that are offered are sometimes marked up big time.
For example, one major insurance company offers an S&P 500 index fund for 1.68% annually when the actual cost is 0.05%. That’s a 3,260% markup!
Small Fees Make a Big Difference
How much do these seemingly tiny percentages really hurt savers? More than you think.
Take two people saving for retirement generating the same return – one is charged 1% in fees, and one is charged 2%.
The 1% difference in fees may not sound like much, but through the power of compound interest, it works out to 10 years of extra retirement money!
What to Do About It?
The problems here are systemic, and not any one company is to be blamed. If you want to take action, here’s what you can do:
Examine: Take a look at your plan’s fee disclosures and the expense ratios of mutual funds you’re invested in. If expense ratios are above 1%, you are likely paying too much.
Compare: Look at available fund options and switch to lower fee options if they offer similar levels of performance.
Lobby: If your 401(k) is getting battered by fees, tell your employer. Employers not only have a fiduciary duty to benchmark their 401(k)s, but also to seek the best option for employees.
The journey towards financial freedom is tough enough as it is – and while a 401(k) is a wonderful tool to help you get there, it needs to be used correctly!


Economy
Economic Growth Forecasts for G7 and BRICS Countries in 2024
The IMF has released its economic growth forecasts for 2024. How do the G7 and BRICS countries compare?


G7 & BRICS Real GDP Growth Forecasts for 2024
The International Monetary Fund’s (IMF) has released its real gross domestic product (GDP) growth forecasts for 2024, and while global growth is projected to stay steady at 3.2%, various major nations are seeing declining forecasts.
This chart visualizes the 2024 real GDP growth forecasts using data from the IMF’s 2024 World Economic Outlook for G7 and BRICS member nations along with Saudi Arabia, which is still considering an invitation to join the bloc.
Get the Key Insights of the IMF’s World Economic Outlook
Want a visual breakdown of the insights from the IMF’s 2024 World Economic Outlook report?
This visual is part of a special dispatch of the key takeaways exclusively for VC+ members.
Get the full dispatch of charts by signing up to VC+.
Mixed Economic Growth Prospects for Major Nations in 2024
Economic growth projections by the IMF for major nations are mixed, with the majority of G7 and BRICS countries forecasted to have slower growth in 2024 compared to 2023.
Only three BRICS-invited or member countries, Saudi Arabia, the UAE, and South Africa, have higher projected real GDP growth rates in 2024 than last year.
| Group | Country | Real GDP Growth (2023) | Real GDP Growth (2024P) |
|---|---|---|---|
| G7 | 🇺🇸 U.S. | 2.5% | 2.7% |
| G7 | 🇨🇦 Canada | 1.1% | 1.2% |
| G7 | 🇯🇵 Japan | 1.9% | 0.9% |
| G7 | 🇫🇷 France | 0.9% | 0.7% |
| G7 | 🇮🇹 Italy | 0.9% | 0.7% |
| G7 | 🇬🇧 UK | 0.1% | 0.5% |
| G7 | 🇩🇪 Germany | -0.3% | 0.2% |
| BRICS | 🇮🇳 India | 7.8% | 6.8% |
| BRICS | 🇨🇳 China | 5.2% | 4.6% |
| BRICS | 🇦🇪 UAE | 3.4% | 3.5% |
| BRICS | 🇮🇷 Iran | 4.7% | 3.3% |
| BRICS | 🇷🇺 Russia | 3.6% | 3.2% |
| BRICS | 🇪🇬 Egypt | 3.8% | 3.0% |
| BRICS-invited | 🇸🇦 Saudi Arabia | -0.8% | 2.6% |
| BRICS | 🇧🇷 Brazil | 2.9% | 2.2% |
| BRICS | 🇿🇦 South Africa | 0.6% | 0.9% |
| BRICS | 🇪🇹 Ethiopia | 7.2% | 6.2% |
| 🌍 World | 3.2% | 3.2% |
China and India are forecasted to maintain relatively high growth rates in 2024 at 4.6% and 6.8% respectively, but compared to the previous year, China is growing 0.6 percentage points slower while India is an entire percentage point slower.
On the other hand, four G7 nations are set to grow faster than last year, which includes Germany making its comeback from its negative real GDP growth of -0.3% in 2023.
Faster Growth for BRICS than G7 Nations
Despite mostly lower growth forecasts in 2024 compared to 2023, BRICS nations still have a significantly higher average growth forecast at 3.6% compared to the G7 average of 1%.
While the G7 countries’ combined GDP is around $15 trillion greater than the BRICS nations, with continued higher growth rates and the potential to add more members, BRICS looks likely to overtake the G7 in economic size within two decades.
BRICS Expansion Stutters Before October 2024 Summit
BRICS’ recent expansion has stuttered slightly, as Argentina’s newly-elected president Javier Milei declined its invitation and Saudi Arabia clarified that the country is still considering its invitation and has not joined BRICS yet.
Even with these initial growing pains, South Africa’s Foreign Minister Naledi Pandor told reporters in February that 34 different countries have submitted applications to join the growing BRICS bloc.
Any changes to the group are likely to be announced leading up to or at the 2024 BRICS summit which takes place October 22-24 in Kazan, Russia.
Get the Full Analysis of the IMF’s Outlook on VC+
This visual is part of an exclusive special dispatch for VC+ members which breaks down the key takeaways from the IMF’s 2024 World Economic Outlook.
For the full set of charts and analysis, sign up for VC+.

-

 Markets1 week ago
U.S. Debt Interest Payments Reach $1 Trillion
-

 Business2 weeks ago
Charted: Big Four Market Share by S&P 500 Audits
-

 Real Estate2 weeks ago
Ranked: The Most Valuable Housing Markets in America
-

 Money2 weeks ago
Which States Have the Highest Minimum Wage in America?
-

 AI2 weeks ago
Ranked: Semiconductor Companies by Industry Revenue Share
-

 Markets2 weeks ago
Ranked: The World’s Top Flight Routes, by Revenue
-

 Demographics2 weeks ago
Population Projections: The World’s 6 Largest Countries in 2075
-

 Markets2 weeks ago
The Top 10 States by Real GDP Growth in 2023