Markets
Ranking the World’s Most Valuable Nation Brands
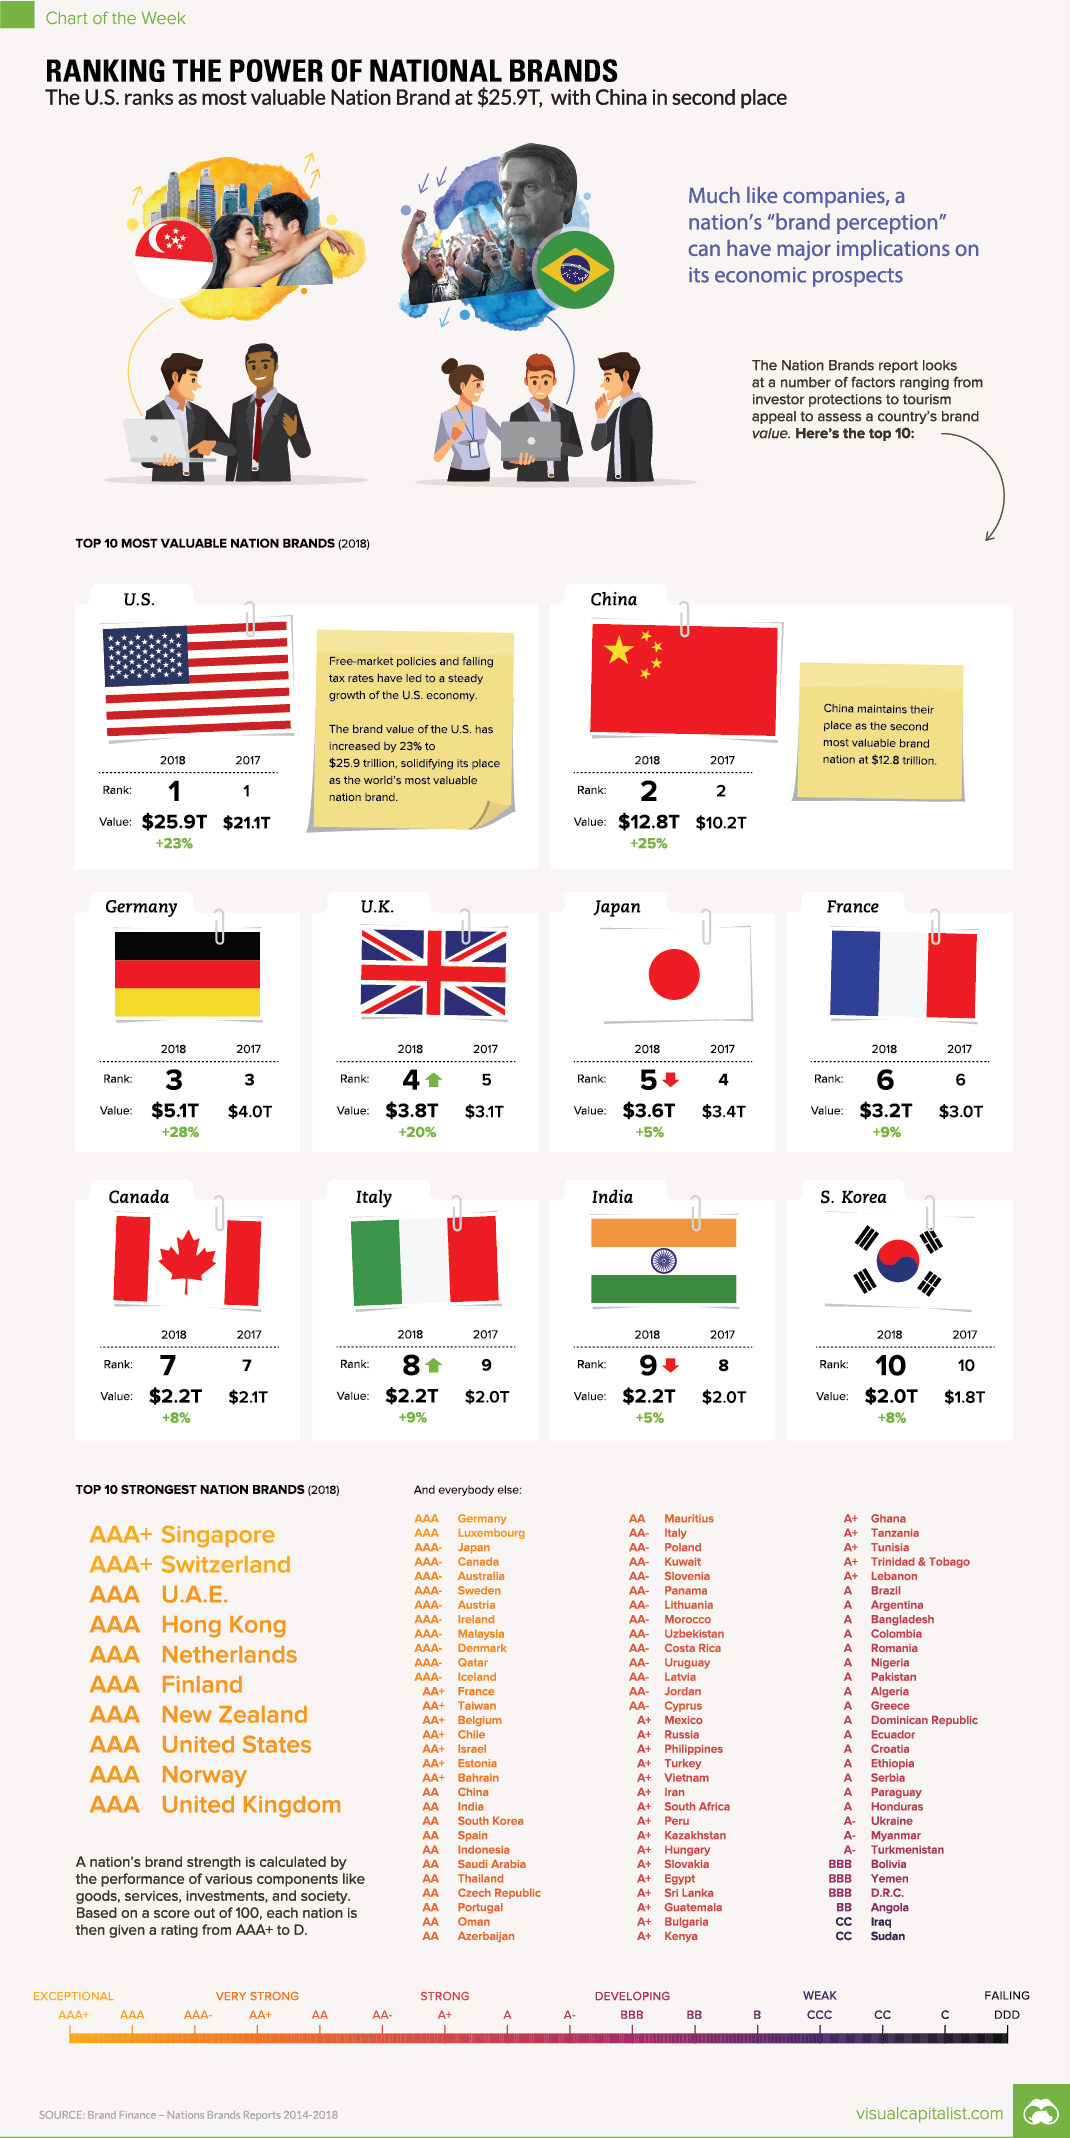
Ranking the World’s Most Valuable Nation Brands
The Chart of the Week is a weekly Visual Capitalist feature on Fridays.
What comes to mind when you think about Spain or Japan?
Just like anything else, our brains tend to associate certain images and attributes with a given country in order to form a unique mental perception.
In a global marketplace, a country’s national image can be one of its most valued assets or a challenging liability. These perceptions help to forge a country’s reputation, and also have a long-lasting impact on future economic potential and the ability to attract new investment.
Introducing Nation Brands
Earlier this week, Brand Finance released its 2018 report in an attempt to place a dollar value on these national perceptions.
While the specific methodology is covered directly in the report, what you need to know is that Brand Finance uses three pillars to calculate a Brand Strength Index score.
The three pillars are:
- Goods & Services: Includes factors such as openness to tourism, market size, and trade rules
- Society: Includes factors such as quality of life, corporate ethics, corruption, and cultural image
- Investment: Includes items such as talent retention, use of technology, R&D, taxation, and regulation
The Brand Index Score is then used to calculate a hypothetical royalty rate, and to forecast revenues to ultimately derive a brand value (post-tax revenues discounted to calculate a net present value).
Which Nation Brands are Most Valuable?
Here are the world’s 15 most valuable nation brands, as ranked in the most recent report.
| Rank | Country | 2018 Brand Value | Change (vs. 2017) |
|---|---|---|---|
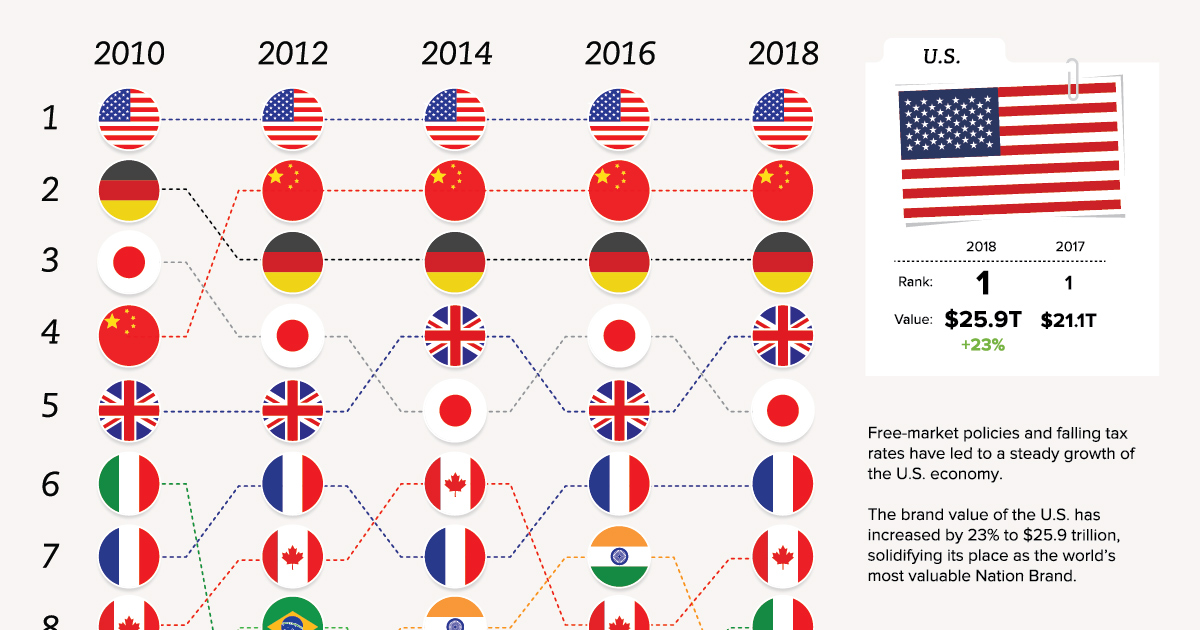
| #1 | United States | $25.9 trillion | 23% |
| #2 | China | $12.8 trillion | 25% |
| #3 | Germany | $5.1 trillion | 28% |
| #4 | United Kingdom | $3.8 trillion | 20% |
| #5 | Japan | $3.6 trillion | 5% |
| #6 | France | $3.2 trillion | 9% |
| #7 | Canada | $2.2 trillion | 8% |
| #8 | Italy | $2.2 trillion | 9% |
| #9 | India | $2.2 trillion | 5% |
| #10 | South Korea | $2.0 trillion | 8% |
| #11 | Australia | $1.7 trillion | 11% |
| #12 | Spain | $1.6 trillion | 14% |
| #13 | Netherlands | $1.2 trillion | 18% |
| #14 | Mexico | $1.1 trillion | 2% |
| #15 | Switzerland | $1.1 trillion | -4% |
The U.S. takes the top spot at $25.9 trillion, but the fastest growing brand valuation was Germany’s, which jumped 28% over the past year.
How the Ranking Has Changed Over Time
Brand valuations can change over time – and looking at Nation Brands over the last eight years helps to get a sense of long-term trends:
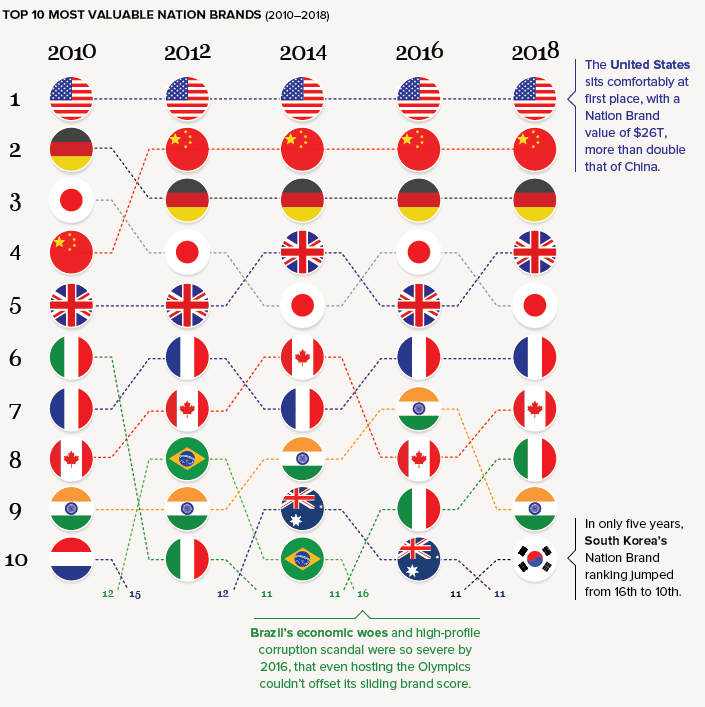
By 2012, China had cemented the second place spot, displacing both Japan and Germany.
Meanwhile, Brazil made a brief appearance in the Top 10, but then precipitously dropped off the list. It now sits at 17th place in the 2018 rankings.


Markets
The European Stock Market: Attractive Valuations Offer Opportunities
On average, the European stock market has valuations that are nearly 50% lower than U.S. valuations. But how can you access the market?


European Stock Market: Attractive Valuations Offer Opportunities
Europe is known for some established brands, from L’Oréal to Louis Vuitton. However, the European stock market offers additional opportunities that may be lesser known.
The above infographic, sponsored by STOXX, outlines why investors may want to consider European stocks.
Attractive Valuations
Compared to most North American and Asian markets, European stocks offer lower or comparable valuations.
| Index | Price-to-Earnings Ratio | Price-to-Book Ratio |
|---|---|---|
| EURO STOXX 50 | 14.9 | 2.2 |
| STOXX Europe 600 | 14.4 | 2 |
| U.S. | 25.9 | 4.7 |
| Canada | 16.1 | 1.8 |
| Japan | 15.4 | 1.6 |
| Asia Pacific ex. China | 17.1 | 1.8 |
Data as of February 29, 2024. See graphic for full index names. Ratios based on trailing 12 month financials. The price to earnings ratio excludes companies with negative earnings.
On average, European valuations are nearly 50% lower than U.S. valuations, potentially offering an affordable entry point for investors.
Research also shows that lower price ratios have historically led to higher long-term returns.
Market Movements Not Closely Connected
Over the last decade, the European stock market had low-to-moderate correlation with North American and Asian equities.
The below chart shows correlations from February 2014 to February 2024. A value closer to zero indicates low correlation, while a value of one would indicate that two regions are moving in perfect unison.
| EURO STOXX 50 | STOXX EUROPE 600 | U.S. | Canada | Japan | Asia Pacific ex. China |
|
|---|---|---|---|---|---|---|
| EURO STOXX 50 | 1.00 | 0.97 | 0.55 | 0.67 | 0.24 | 0.43 |
| STOXX EUROPE 600 | 1.00 | 0.56 | 0.71 | 0.28 | 0.48 | |
| U.S. | 1.00 | 0.73 | 0.12 | 0.25 | ||
| Canada | 1.00 | 0.22 | 0.40 | |||
| Japan | 1.00 | 0.88 | ||||
| Asia Pacific ex. China | 1.00 |
Data is based on daily USD returns.
European equities had relatively independent market movements from North American and Asian markets. One contributing factor could be the differing sector weights in each market. For instance, technology makes up a quarter of the U.S. market, but health care and industrials dominate the broader European market.
Ultimately, European equities can enhance portfolio diversification and have the potential to mitigate risk for investors.
Tracking the Market
For investors interested in European equities, STOXX offers a variety of flagship indices:
| Index | Description | Market Cap |
|---|---|---|
| STOXX Europe 600 | Pan-regional, broad market | €10.5T |
| STOXX Developed Europe | Pan-regional, broad-market | €9.9T |
| STOXX Europe 600 ESG-X | Pan-regional, broad market, sustainability focus | €9.7T |
| STOXX Europe 50 | Pan-regional, blue-chip | €5.1T |
| EURO STOXX 50 | Eurozone, blue-chip | €3.5T |
Data is as of February 29, 2024. Market cap is free float, which represents the shares that are readily available for public trading on stock exchanges.
The EURO STOXX 50 tracks the Eurozone’s biggest and most traded companies. It also underlies one of the world’s largest ranges of ETFs and mutual funds. As of November 2023, there were €27.3 billion in ETFs and €23.5B in mutual fund assets under management tracking the index.
“For the past 25 years, the EURO STOXX 50 has served as an accurate, reliable and tradable representation of the Eurozone equity market.”
— Axel Lomholt, General Manager at STOXX
Partnering with STOXX to Track the European Stock Market
Are you interested in European equities? STOXX can be a valuable partner:
- Comprehensive, liquid and investable ecosystem
- European heritage, global reach
- Highly sophisticated customization capabilities
- Open architecture approach to using data
- Close partnerships with clients
- Part of ISS STOXX and Deutsche Börse Group
With a full suite of indices, STOXX can help you benchmark against the European stock market.
Learn how STOXX’s European indices offer liquid and effective market access.

-

 Economy4 days ago
Economic Growth Forecasts for G7 and BRICS Countries in 2024
The IMF has released its economic growth forecasts for 2024. How do the G7 and BRICS countries compare?
-

 Markets2 weeks ago
U.S. Debt Interest Payments Reach $1 Trillion
U.S. debt interest payments have surged past the $1 trillion dollar mark, amid high interest rates and an ever-expanding debt burden.
-

 United States2 weeks ago
Ranked: The Largest U.S. Corporations by Number of Employees
We visualized the top U.S. companies by employees, revealing the massive scale of retailers like Walmart, Target, and Home Depot.
-

 Markets2 weeks ago
The Top 10 States by Real GDP Growth in 2023
This graphic shows the states with the highest real GDP growth rate in 2023, largely propelled by the oil and gas boom.
-

 Markets3 weeks ago
Ranked: The World’s Top Flight Routes, by Revenue
In this graphic, we show the highest earning flight routes globally as air travel continued to rebound in 2023.
-

 Markets3 weeks ago
Ranked: The Most Valuable Housing Markets in America
The U.S. residential real estate market is worth a staggering $47.5 trillion. Here are the most valuable housing markets in the country.


-

 Science1 week ago
Visualizing the Average Lifespans of Mammals
-

 Demographics2 weeks ago
The Smallest Gender Wage Gaps in OECD Countries
-

 United States2 weeks ago
Where U.S. Inflation Hit the Hardest in March 2024
-

 Green2 weeks ago
Top Countries By Forest Growth Since 2001
-
United States2 weeks ago
Ranked: The Largest U.S. Corporations by Number of Employees
-

 Maps2 weeks ago
The Largest Earthquakes in the New York Area (1970-2024)
-

 Green2 weeks ago
Ranked: The Countries With the Most Air Pollution in 2023
-

 Green2 weeks ago
Ranking the Top 15 Countries by Carbon Tax Revenue