Markets
Mapped: Investment Risk, by Country
Subscribe to the Advisor Channel free mailing list for more like this
Mapped: Investment Risk, by Country
This was originally posted on Advisor Channel. Sign up to the free mailing list to get beautiful visualizations on financial markets that help advisors and their clients.
What is the risk of investing in another country?
Given the rapid growth of emerging economies, and the opportunities this may present to investors, it raises the question: does investment exposure abroad come with risk, and how can that risk be analyzed?
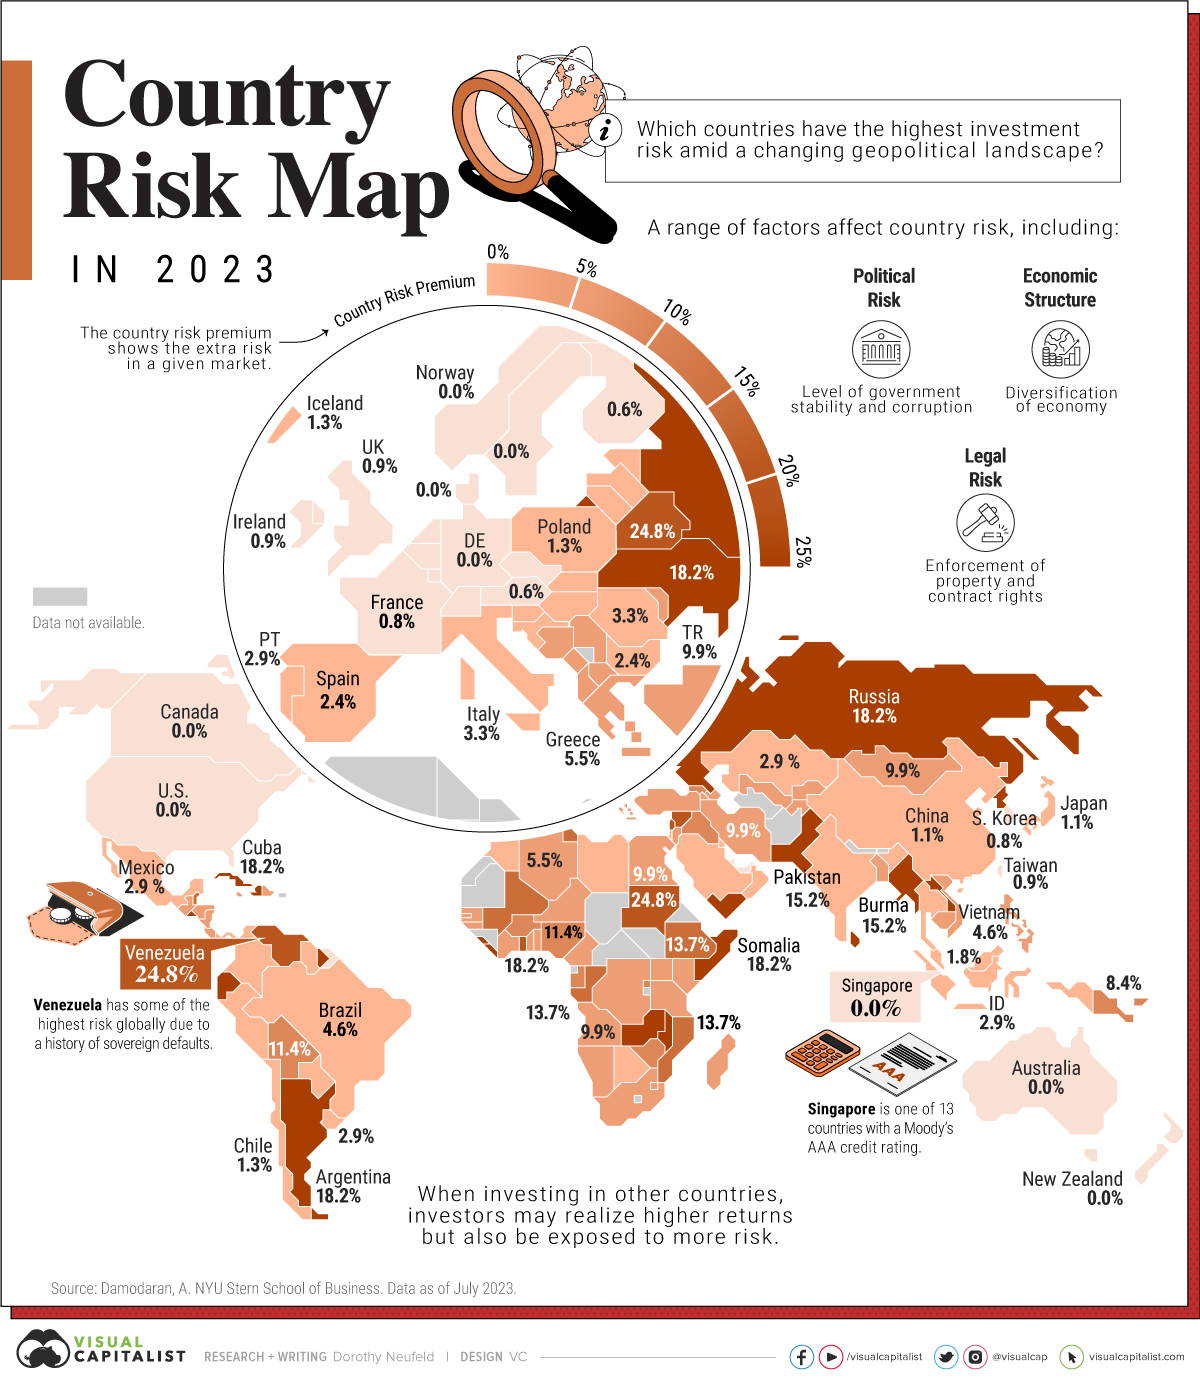
To help answer this question, this graphic shows country risk around the world, based on analysis from Aswath Damodaran at New York University’s Stern School of Business.
The Methodology
For many reasons, there are variations in risk across different countries. These can be influenced by geopolitical factors, such as political risk, whether they are in a stage of early growth, or have stable property rights.
To get a clearer picture of country risk, Damodaran analyzed the following broad factors:
- Political risk: Type of regime, corruption, level of conflict
- Legal risk: Property rights protections, contract rights
- Economic risk: Diversification of economy
In addition, a nation’s default risk was analyzed, which is a common measure used in financial markets. When a nation defaults on its debt, it often leads to market turbulence, and other negative effects that can last for many years.
Together, these factors, along with others, estimate a country risk premium, which is the extra risk in a given market. The U.S. served as baseline for measuring the extra risk of each country.
Investment Risk in 2023
Below, we show country risk around the world, from highest to lowest risk as of July, 2023:
| Country | Country Risk Premium |
|---|---|
| 🇧🇾 Belarus | 24.8% |
| 🇱🇧 Lebanon | 24.8% |
| 🇻🇪 Venezuela | 24.8% |
| 🇸🇩 Sudan | 24.8% |
| 🇸🇾 Syria | 24.8% |
| 🇦🇷 Argentina | 18.2% |
| 🇨🇺 Cuba | 18.2% |
| 🇬🇭 Ghana | 18.2% |
| 🇷🇺 Russia | 18.2% |
| 🇱🇰 Sri Lanka | 18.2% |
| 🇺🇦 Ukraine | 18.2% |
| 🇿🇲 Zambia | 18.2% |
| 🇭🇹 Haiti | 18.2% |
| 🇰🇵 North Korea | 18.2% |
| 🇲🇼 Malawi | 18.2% |
| 🇸🇱 Sierra Leone | 18.2% |
| 🇸🇴 Somalia | 18.2% |
| 🇪🇨 Ecuador | 15.2% |
| 🇸🇻 El Salvador | 15.2% |
| 🇱🇦 Laos | 15.2% |
| 🇵🇰 Pakistan | 15.2% |
| 🇸🇷 Suriname | 15.2% |
| 🇱🇷 Liberia | 15.2% |
| 🇲🇲 Myanmar | 15.2% |
| 🇾🇪 Yemen | 15.2% |
| 🇧🇿 Belize | 13.7% |
| 🇨🇬 Congo (Republic of) | 13.7% |
| 🇪🇹 Ethiopia | 13.7% |
| 🇲🇱 Mali | 13.7% |
| 🇲🇿 Mozambique | 13.7% |
| 🇹🇳 Tunisia | 13.7% |
| 🇬🇳 Guinea | 13.7% |
| 🇧🇧 Barbados | 11.4% |
| 🇧🇴 Bolivia | 11.4% |
| 🇧🇫 Burkina Faso | 11.4% |
| 🇬🇦 Gabon | 11.4% |
| 🇮🇶 Iraq | 11.4% |
| 🇲🇻 Maldives | 11.4% |
| 🇳🇬 Nigeria | 11.4% |
| 🇸🇧 Solomon Islands | 11.4% |
| 🇿🇼 Zimbabwe | 11.4% |
| 🇦🇴 Angola | 9.9% |
| 🇧🇦 Bosnia and Herzegovina | 9.9% |
| 🇨🇻 Cape Verde | 9.9% |
| 🇨🇩 Congo (Democratic Republic of) | 9.9% |
| 🇪🇬 Egypt | 9.9% |
| 🇰🇪 Kenya | 9.9% |
| 🇰🇬 Kyrgyzstan | 9.9% |
| 🇲🇩 Moldova | 9.9% |
| 🇲🇳 Mongolia | 9.9% |
| 🇳🇮 Nicaragua | 9.9% |
| 🇳🇪 Niger | 9.9% |
| 🇻🇨 St. Vincent & the Grenadines | 9.9% |
| 🇸🇿 Swaziland | 9.9% |
| 🇹🇯 Tajikistan | 9.9% |
| 🇹🇬 Togo | 9.9% |
| 🇹🇷 Turkey | 9.9% |
| 🇮🇷 Iran | 9.9% |
| 🇲🇬 Madagascar | 9.9% |
| 🇧🇭 Bahrain | 8.4% |
| 🇰🇭 Cambodia | 8.4% |
| 🇨🇲 Cameroon | 8.4% |
| 🇨🇰 Cook Islands | 8.4% |
| 🇨🇷 Costa Rica | 8.4% |
| 🇯🇲 Jamaica | 8.4% |
| 🇵🇬 Papua New Guinea | 8.4% |
| 🇷🇼 Rwanda | 8.4% |
| 🇹🇿 Tanzania | 8.4% |
| 🇺🇬 Uganda | 8.4% |
| 🇬🇲 Gambia | 8.4% |
| 🇬🇼 Guinea-Bissau | 8.4% |
| 🇦🇱 Albania | 6.8% |
| 🇧🇸 Bahamas | 6.8% |
| 🇧🇩 Bangladesh | 6.8% |
| 🇧🇯 Benin | 6.8% |
| 🇫🇯 Fiji | 6.8% |
| 🇭🇳 Honduras | 6.8% |
| 🇯🇴 Jordan | 6.8% |
| 🇲🇪 Montenegro | 6.8% |
| 🇳🇦 Namibia | 6.8% |
| 🇦🇲 Armenia | 5.5% |
| 🇨🇮 Côte d'Ivoire | 5.5% |
| 🇩🇴 Dominican Republic | 5.5% |
| 🇬🇷 Greece | 5.5% |
| 🇲🇰 Macedonia | 5.5% |
| 🇸🇳 Senegal | 5.5% |
| 🇺🇿 Uzbekistan | 5.5% |
| 🇩🇿 Algeria | 5.5% |
| 🇧🇷 Brazil | 4.6% |
| 🇬🇪 Georgia | 4.6% |
| 🇴🇲 Oman | 4.6% |
| 🇷🇸 Serbia | 4.6% |
| 🇿🇦 South Africa | 4.6% |
| 🇸🇽 St. Maarten | 4.6% |
| 🇹🇹 Trinidad and Tobago | 4.6% |
| 🇻🇳 Vietnam | 4.6% |
| 🇦🇿 Azerbaijan | 3.8% |
| 🇨🇾 Cyprus | 3.8% |
| 🇬🇹 Guatemala | 3.8% |
| 🇲🇦 Morocco | 3.8% |
| 🇵🇾 Paraguay | 3.8% |
| 🇸🇭 Sharjah | 3.8% |
| 🇮🇳 India | 3.3% |
| 🇮🇹 Italy | 3.3% |
| 🇲🇺 Mauritius | 3.3% |
| 🇲🇸 Montserrat | 3.3% |
| 🇷🇴 Romania | 3.3% |
| 🇦🇩 Andorra | 2.9% |
| 🇦🇼 Aruba | 2.9% |
| 🇨🇴 Colombia | 2.9% |
| 🇭🇷 Croatia | 2.9% |
| 🇨🇼 Curacao | 2.9% |
| 🇭🇺 Hungary | 2.9% |
| 🇮🇩 Indonesia | 2.9% |
| 🇰🇿 Kazakhstan | 2.9% |
| 🇲🇽 Mexico | 2.9% |
| 🇵🇦 Panama | 2.9% |
| 🇵🇭 Philippines | 2.9% |
| 🇵🇹 Portugal | 2.9% |
| 🇺🇾 Uruguay | 2.9% |
| 🇱🇾 Libya | 2.9% |
| 🇧🇬 Bulgaria | 2.4% |
| 🇵🇪 Peru | 2.4% |
| 🇪🇸 Spain | 2.4% |
| 🇹🇭 Thailand | 2.4% |
| 🇹🇨 Turks and Caicos | 2.4% |
| 🇬🇾 Guyana | 2.4% |
| 🇧🇼 Botswana | 1.8% |
| 🇱🇻 Latvia | 1.8% |
| 🇲🇾 Malaysia | 1.8% |
| 🇸🇮 Slovenia | 1.8% |
| 🇧🇲 Bermuda | 1.3% |
| 🇨🇱 Chile | 1.3% |
| 🇮🇸 Iceland | 1.3% |
| 🇱🇹 Lithuania | 1.3% |
| 🇲🇹 Malta | 1.3% |
| 🇵🇱 Poland | 1.3% |
| 🇸🇰 Slovakia | 1.3% |
| 🇨🇳 China | 1.1% |
| 🇪🇪 Estonia | 1.1% |
| 🇮🇱 Israel | 1.1% |
| 🇯🇵 Japan | 1.1% |
| 🇰🇼 Kuwait | 1.1% |
| 🇸🇦 Saudi Arabia | 1.1% |
| 🇧🇪 Belgium | 0.9% |
| 🇰🇾 Cayman Islands | 0.9% |
| 🇨🇿 Czech Republic | 0.9% |
| 🇭🇰 Hong Kong | 0.9% |
| 🇮🇪 Ireland | 0.9% |
| 🇮🇲 Isle of Man | 0.9% |
| 🇯🇪 Jersey | 0.9% |
| 🇲🇴 Macao | 0.9% |
| 🇶🇦 Qatar | 0.9% |
| 🇹🇼 Taiwan | 0.9% |
| 🇬🇧 UK | 0.9% |
| 🇧🇳 Brunei | 0.9% |
| 🇦🇪 Abu Dhabi | 0.8% |
| 🇫🇷 France | 0.8% |
| 🇬🇬 Guernsey | 0.8% |
| 🇰🇷 Korea | 0.8% |
| 🇦🇪 U.A.E. | 0.8% |
| 🇦🇹 Austria | 0.6% |
| 🇫🇮 Finland | 0.6% |
| 🇦🇺 Australia | 0.0% |
| 🇨🇦 Canada | 0.0% |
| 🇩🇰 Denmark | 0.0% |
| 🇩🇪 Germany | 0.0% |
| 🇱🇮 Liechtenstein | 0.0% |
| 🇱🇺 Luxembourg | 0.0% |
| 🇳🇱 Netherlands | 0.0% |
| 🇳🇿 New Zealand | 0.0% |
| 🇳🇴 Norway | 0.0% |
| 🇸🇬 Singapore | 0.0% |
| 🇸🇪 Sweden | 0.0% |
| 🇨🇭 Switzerland | 0.0% |
| 🇺🇸 U.S. | 0.0% |
As the table above shows, five countries share the highest risk: Belarus, Lebanon, Venezuela, Sudan, and Syria. In Belarus, Russian military forces continue to operate. Venezuela has faced hyperinflation and endemic corruption for many years.
On the other hand, 13 countries had the lowest risk, including several European nations, Singapore, and New Zealand. This is due to factors such as their AAA-rated government bonds, low corruption, and strong property right protections.
What Does This Mean for Investors?
The growth of emerging economies presents opportunities for investors, shaped by demographic influences, rising GDP, and technological advancements seen globally.
Adding to this, diversification across sectors, assets, and geographies may stand to benefit investors more generally.
With this in mind, investments in other countries are exposed to country risks that go beyond, but ultimately influence the long-term performance of stocks, bonds, and other financial assets. Considering these factors, the reward of investing in international companies may come with macroeconomic and country-specific risks.


Markets
The European Stock Market: Attractive Valuations Offer Opportunities
On average, the European stock market has valuations that are nearly 50% lower than U.S. valuations. But how can you access the market?


European Stock Market: Attractive Valuations Offer Opportunities
Europe is known for some established brands, from L’Oréal to Louis Vuitton. However, the European stock market offers additional opportunities that may be lesser known.
The above infographic, sponsored by STOXX, outlines why investors may want to consider European stocks.
Attractive Valuations
Compared to most North American and Asian markets, European stocks offer lower or comparable valuations.
| Index | Price-to-Earnings Ratio | Price-to-Book Ratio |
|---|---|---|
| EURO STOXX 50 | 14.9 | 2.2 |
| STOXX Europe 600 | 14.4 | 2 |
| U.S. | 25.9 | 4.7 |
| Canada | 16.1 | 1.8 |
| Japan | 15.4 | 1.6 |
| Asia Pacific ex. China | 17.1 | 1.8 |
Data as of February 29, 2024. See graphic for full index names. Ratios based on trailing 12 month financials. The price to earnings ratio excludes companies with negative earnings.
On average, European valuations are nearly 50% lower than U.S. valuations, potentially offering an affordable entry point for investors.
Research also shows that lower price ratios have historically led to higher long-term returns.
Market Movements Not Closely Connected
Over the last decade, the European stock market had low-to-moderate correlation with North American and Asian equities.
The below chart shows correlations from February 2014 to February 2024. A value closer to zero indicates low correlation, while a value of one would indicate that two regions are moving in perfect unison.
| EURO STOXX 50 | STOXX EUROPE 600 | U.S. | Canada | Japan | Asia Pacific ex. China |
|
|---|---|---|---|---|---|---|
| EURO STOXX 50 | 1.00 | 0.97 | 0.55 | 0.67 | 0.24 | 0.43 |
| STOXX EUROPE 600 | 1.00 | 0.56 | 0.71 | 0.28 | 0.48 | |
| U.S. | 1.00 | 0.73 | 0.12 | 0.25 | ||
| Canada | 1.00 | 0.22 | 0.40 | |||
| Japan | 1.00 | 0.88 | ||||
| Asia Pacific ex. China | 1.00 |
Data is based on daily USD returns.
European equities had relatively independent market movements from North American and Asian markets. One contributing factor could be the differing sector weights in each market. For instance, technology makes up a quarter of the U.S. market, but health care and industrials dominate the broader European market.
Ultimately, European equities can enhance portfolio diversification and have the potential to mitigate risk for investors.
Tracking the Market
For investors interested in European equities, STOXX offers a variety of flagship indices:
| Index | Description | Market Cap |
|---|---|---|
| STOXX Europe 600 | Pan-regional, broad market | €10.5T |
| STOXX Developed Europe | Pan-regional, broad-market | €9.9T |
| STOXX Europe 600 ESG-X | Pan-regional, broad market, sustainability focus | €9.7T |
| STOXX Europe 50 | Pan-regional, blue-chip | €5.1T |
| EURO STOXX 50 | Eurozone, blue-chip | €3.5T |
Data is as of February 29, 2024. Market cap is free float, which represents the shares that are readily available for public trading on stock exchanges.
The EURO STOXX 50 tracks the Eurozone’s biggest and most traded companies. It also underlies one of the world’s largest ranges of ETFs and mutual funds. As of November 2023, there were €27.3 billion in ETFs and €23.5B in mutual fund assets under management tracking the index.
“For the past 25 years, the EURO STOXX 50 has served as an accurate, reliable and tradable representation of the Eurozone equity market.”
— Axel Lomholt, General Manager at STOXX
Partnering with STOXX to Track the European Stock Market
Are you interested in European equities? STOXX can be a valuable partner:
- Comprehensive, liquid and investable ecosystem
- European heritage, global reach
- Highly sophisticated customization capabilities
- Open architecture approach to using data
- Close partnerships with clients
- Part of ISS STOXX and Deutsche Börse Group
With a full suite of indices, STOXX can help you benchmark against the European stock market.
Learn how STOXX’s European indices offer liquid and effective market access.

-

 Economy3 days ago
Economic Growth Forecasts for G7 and BRICS Countries in 2024
The IMF has released its economic growth forecasts for 2024. How do the G7 and BRICS countries compare?
-

 Markets2 weeks ago
U.S. Debt Interest Payments Reach $1 Trillion
U.S. debt interest payments have surged past the $1 trillion dollar mark, amid high interest rates and an ever-expanding debt burden.
-

 United States2 weeks ago
Ranked: The Largest U.S. Corporations by Number of Employees
We visualized the top U.S. companies by employees, revealing the massive scale of retailers like Walmart, Target, and Home Depot.
-

 Markets2 weeks ago
The Top 10 States by Real GDP Growth in 2023
This graphic shows the states with the highest real GDP growth rate in 2023, largely propelled by the oil and gas boom.
-

 Markets3 weeks ago
Ranked: The World’s Top Flight Routes, by Revenue
In this graphic, we show the highest earning flight routes globally as air travel continued to rebound in 2023.
-

 Markets3 weeks ago
Ranked: The Most Valuable Housing Markets in America
The U.S. residential real estate market is worth a staggering $47.5 trillion. Here are the most valuable housing markets in the country.

-

 Sports1 week ago
The Highest Earning Athletes in Seven Professional Sports
-

 Countries2 weeks ago
Population Projections: The World’s 6 Largest Countries in 2075
-
Markets2 weeks ago
The Top 10 States by Real GDP Growth in 2023
-

 Demographics2 weeks ago
The Smallest Gender Wage Gaps in OECD Countries
-

 United States2 weeks ago
Where U.S. Inflation Hit the Hardest in March 2024
-

 Green2 weeks ago
Top Countries By Forest Growth Since 2001
-
United States2 weeks ago
Ranked: The Largest U.S. Corporations by Number of Employees
-

 Maps2 weeks ago
The Largest Earthquakes in the New York Area (1970-2024)