3 Reasons to Explore International Stocks Now
3 Reasons to Explore International Stocks Now
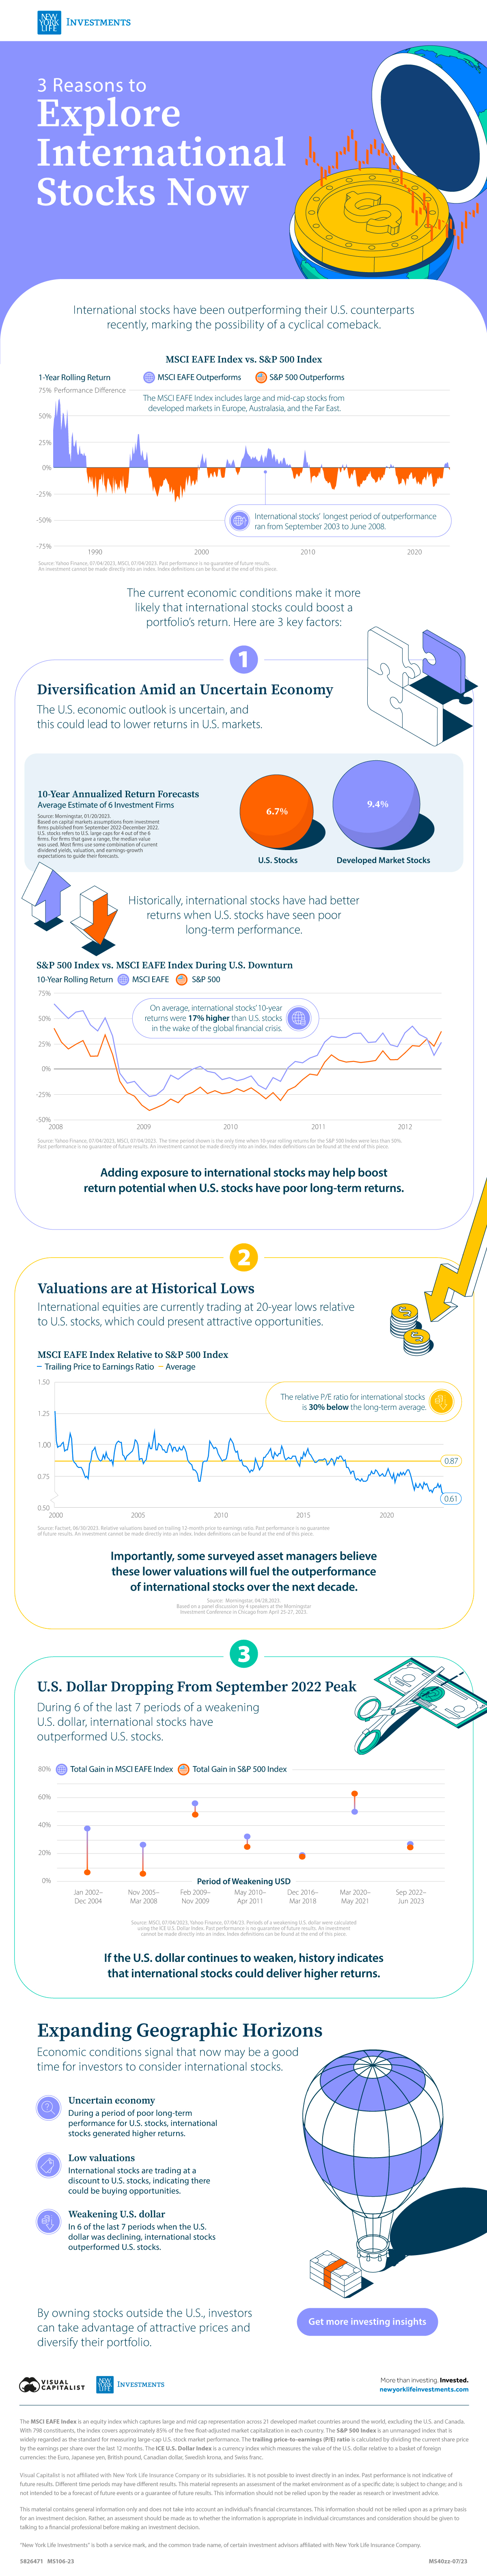
International stocks have been outperforming their U.S. counterparts recently, based on a one-year rolling return. Could they be due for a cyclical comeback?
In this graphic from New York Life Investments, we explore why current economic conditions make it more likely that international investments could boost a portfolio’s return.
1. Diversification Amid an Uncertain Economy
The U.S. economic outlook is uncertain, and this could lead to lower returns in U.S. markets.
In fact, investment firms predict that U.S. stocks could see an annualized return of 6.7% over the next 10 years, compared to 9.4% for developed market stocks. This is based on an average of capital market assumptions from six investment firms published at the end of 2022.
Historically, international stocks have generated better returns when U.S. stocks have seen poor long-term performance. As seen in the below table, in the wake of the global financial crisis, international equities’ 10-year returns were 17% higher than U.S. equities on average.
| Date | S&P 500 10-yr Rolling Return | MSCI EAFE 10 -yr Rolling Return | Performance Difference MSCI EAFE - S&P 500 |
|---|---|---|---|
| January 2008 | 41% | 65% | 24% |
| February 2008 | 27% | 57% | 30% |
| March 2008 | 20% | 50% | 30% |
| April 2008 | 25% | 57% | 32% |
| May 2008 | 28% | 58% | 30% |
| June 2008 | 13% | 44% | 31% |
| July 2008 | 13% | 38% | 25% |
| August 2008 | 34% | 51% | 17% |
| September 2008 | 15% | 33% | 18% |
| October 2008 | -12% | -4% | 8% |
| November 2008 | -23% | -14% | 9% |
| December 2008 | -27% | -12% | 15% |
| January 2009 | -36% | -20% | 15% |
| February 2009 | -41% | -27% | 14% |
| March 2009 | -38% | -26% | 12% |
| April 2009 | -35% | -20% | 15% |
| May 2009 | -29% | -6% | 24% |
| June 2009 | -33% | -10% | 23% |
| July 2009 | -26% | -5% | 21% |
| August 2009 | -23% | 0% | 23% |
| September 2009 | -18% | 3% | 21% |
| October 2009 | -24% | -2% | 22% |
| November 2009 | -21% | -4% | 18% |
| December 2009 | -24% | -10% | 14% |
| January 2010 | -23% | -8% | 15% |
| February 2010 | -19% | -11% | 8% |
| March 2010 | -22% | -10% | 12% |
| April 2010 | -18% | -7% | 12% |
| May 2010 | -23% | -16% | 8% |
| June 2010 | -29% | -20% | 10% |
| July 2010 | -23% | -8% | 15% |
| August 2010 | -31% | -12% | 19% |
| September 2010 | -21% | 2% | 22% |
| October 2010 | -17% | 8% | 25% |
| November 2010 | -10% | 6% | 17% |
| December 2010 | -5% | 11% | 16% |
| January 2010 | -6% | 14% | 20% |
| February 2010 | 7% | 27% | 20% |
| March 2011 | 14% | 33% | 18% |
| April 2011 | 9% | 31% | 22% |
| May 2011 | 7% | 32% | 24% |
| June 2011 | 8% | 35% | 28% |
| July 2011 | 7% | 36% | 29% |
| August 2011 | 8% | 27% | 19% |
| September 2011 | 9% | 27% | 18% |
| October 2011 | 18% | 36% | 18% |
| November 2011 | 9% | 24% | 15% |
| December 2011 | 10% | 22% | 13% |
| January 2012 | 16% | 36% | 20% |
| February 2012 | 23% | 43% | 19% |
| March 2012 | 23% | 34% | 12% |
| April 2012 | 30% | 31% | 1% |
| May 2012 | 23% | 14% | -9% |
| June 2012 | 38% | 27% | -11% |
Source: Yahoo Finance and MSCI, 07/04/2023. The time period shown is the only time when 10-year rolling returns for the S&P 500 Index were less than 50%.
Adding exposure to international investments may help boost return potential when U.S. equities are underperforming on a long-term basis.
2. Valuations are at Historical Lows
International equities are currently trading at 20-year lows relative to U.S. stocks, which could present attractive opportunities.
In fact, the relative P/E ratio for international equities is 30% below the long-term average.
| Date | Trailing Price to Earnings Ratio, MSCI EAFE Relative to S&P 500 |
|---|---|
| June 2023 | 0.61 |
| Average, January 2000-June 2023 | 0.87 |
Source: Factset, 06/30/2023.
Importantly, some surveyed asset managers believe these lower valuations will fuel the outperformance of international investments over the next decade.
3. U.S. Dollar Dropping From September 2022 Peak
During six of the last seven periods of a weakening U.S. dollar, international equities have outperformed U.S. stocks.
| Period of Weakening USD | Total Gain in MSCI EAFE Index | Total Gain in S&P 500 Index | Performance Difference MSCI EAFE - S&P 500 |
|---|---|---|---|
| Jan 2002-Dec 2004 | 39% | 7% | 32% |
| Nov 2005-Mar 2008 | 27% | 6% | 21% |
| Feb 2009-Nov 2009 | 56% | 49% | 7% |
| May 2010-Apr 2011 | 32% | 25% | 7% |
| Dec 2016-Mar 2018 | 19% | 18% | 1% |
| Mar 2020-May 2021 | 50% | 63% | -13% |
| Sep 2022-Jun 2023 | 28% | 24% | 4% |
Source: MSCI and Yahoo Finance, 07/04/2023. Periods of a weakening U.S. dollar were calculated using the ICE U.S. Dollar Index.
If the U.S. dollar continues to weaken, history indicates that international investments could deliver higher returns.
Expanding to International Stocks
Current economic conditions signal that now may be a good time for investors to consider international investments.
- Uncertain economy: Exposure to international equities may help boost returns when long-term U.S. stock performance is lagging.
- Low valuations: International equities are trading at a discount to U.S. stocks, indicating there could be buying opportunities.
- Weakening U.S. dollar: In six of the last seven periods when the U.S. dollar was declining, international investments outperformed U.S. stocks.
By owning stocks outside the U.S., investors can take advantage of attractive prices and diversify their portfolio.
Get more investing insights from New York Life Investments.

-

 Economy3 days ago
Economic Growth Forecasts for G7 and BRICS Countries in 2024
The IMF has released its economic growth forecasts for 2024. How do the G7 and BRICS countries compare?
-

 Markets2 weeks ago
U.S. Debt Interest Payments Reach $1 Trillion
U.S. debt interest payments have surged past the $1 trillion dollar mark, amid high interest rates and an ever-expanding debt burden.
-

 United States2 weeks ago
Ranked: The Largest U.S. Corporations by Number of Employees
We visualized the top U.S. companies by employees, revealing the massive scale of retailers like Walmart, Target, and Home Depot.
-

 Markets2 weeks ago
The Top 10 States by Real GDP Growth in 2023
This graphic shows the states with the highest real GDP growth rate in 2023, largely propelled by the oil and gas boom.
-

 Markets2 weeks ago
Ranked: The World’s Top Flight Routes, by Revenue
In this graphic, we show the highest earning flight routes globally as air travel continued to rebound in 2023.
-

 Markets3 weeks ago
Ranked: The Most Valuable Housing Markets in America
The U.S. residential real estate market is worth a staggering $47.5 trillion. Here are the most valuable housing markets in the country.
