Maps
Mapped: Asia’s Population Patterns by Density
![]() See this visualization first on the Voronoi app.
See this visualization first on the Voronoi app.
A Map of Asia’s Population Patterns by Density
This was originally posted on our Voronoi app. Download the app for free on iOS or Android and discover incredible data-driven charts from a variety of trusted sources.
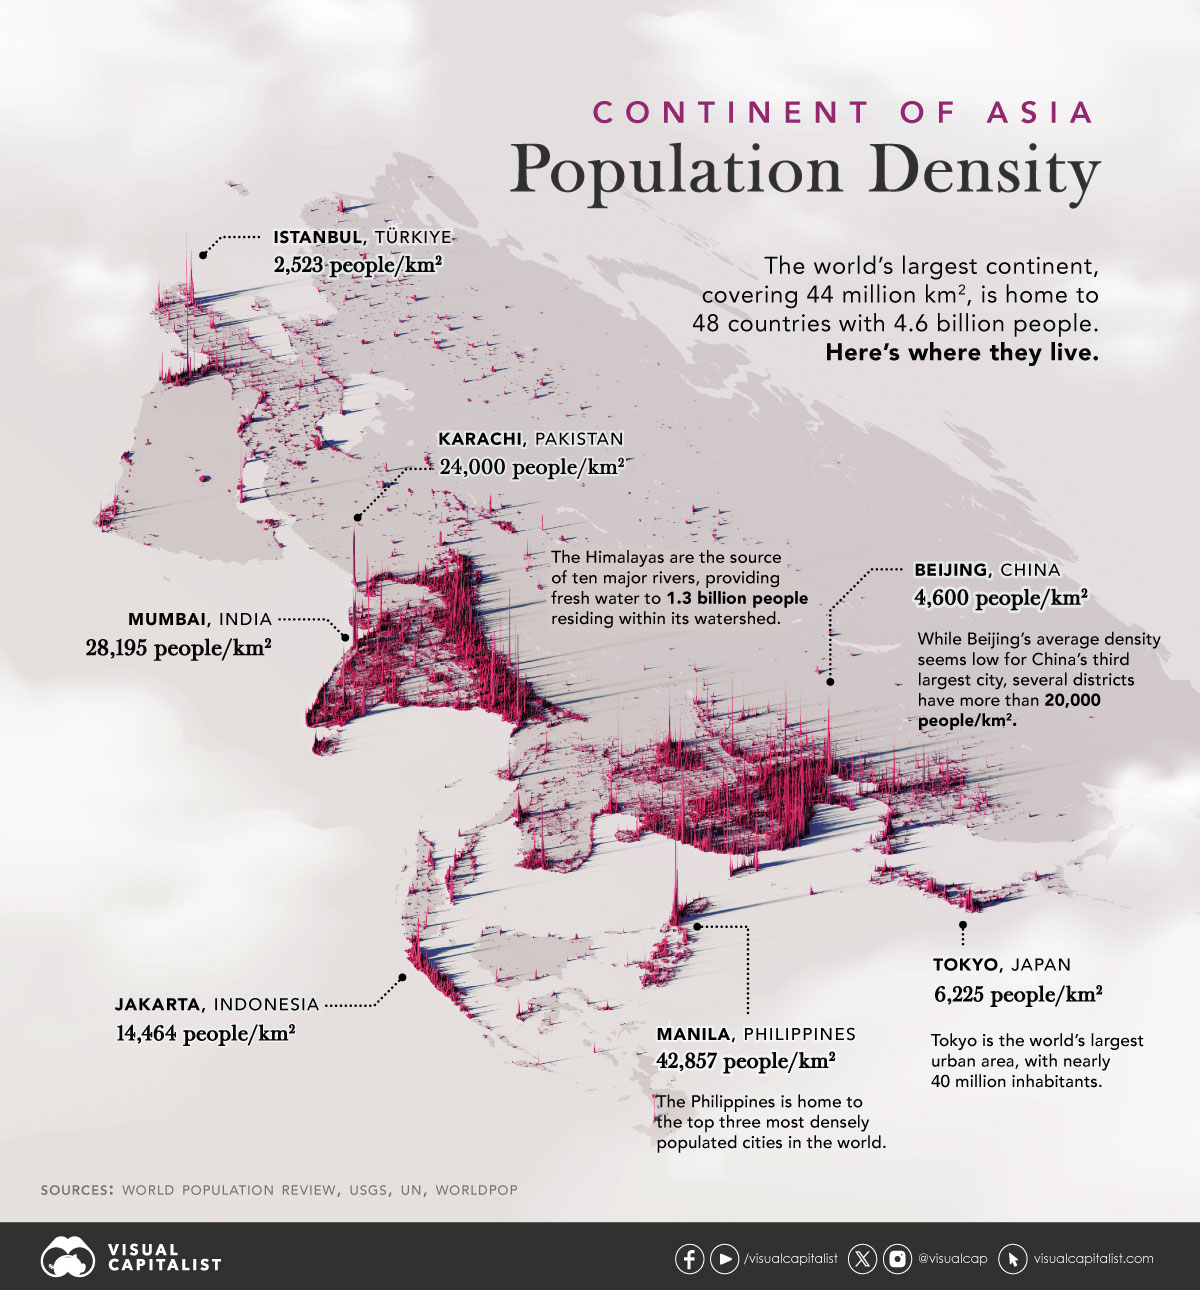
Nearly 60% of the world’s 8 billion population lives in Asia: a vast continent sprawling over 44 million km², home to sprawling megacities, high-altitude deserts, the world’s biggest plateau, and impenetrable rainforests.
We visualize Asia’s population patterns using data from WorldPop—a research group based out of the University of Southampton that tracks population growth and movement across the globe.
A spike on the map denotes higher population density.
Other figures in this article are sourced from World Population Review (population numbers) and the World Bank (area).
Ranked: Asia’s Countries By Population
Immediately the map visualizes at impressive scale a rather well-known fact: that India and China together account for 35% of the world’s population just by themselves.
Pakistan (ranked 4th in population) and Bangladesh (ranked 5th) together account for another 400 million people.
The role of the Himalayas in this distribution is understated: the mountain range is a source of ten major rivers, flowing to India, Nepal, Bangladesh, Pakistan, and China, providing fresh water to 1.3 billion people in its watershed.
| Rank | Country | Population | Area |
|---|---|---|---|
| 1 | 🇮🇳 India | 1,437,982,661 | 3,287,260 km² |
| 2 | 🇨🇳 China | 1,425,317,720 | 9,562,910 km² |
| 3 | 🇮🇩 Indonesia | 279,119,626 | 1,916,907 km² |
| 4 | 🇵🇰 Pakistan | 243,772,596 | 796,100 km² |
| 5 | 🇧🇩 Bangladesh | 174,173,808 | 147,570 km² |
| 6 | 🇷🇺 Russia | 144,101,449 | 17,098,250 km² |
| 7 | 🇯🇵 Japan | 122,833,540 | 377,974 km² |
| 8 | 🇵🇭 Philippines | 119,106,224 | 300,000 km² |
| 9 | 🇻🇳 Vietnam | 99,308,524 | 331,340 km² |
| 10 | 🇮🇷 Iran | 89,626,661 | 1,745,150 km² |
| 11 | 🇹🇷 Turkey | 86,127,389 | 785,350 km² |
| 12 | 🇹🇭 Thailand | 71,863,281 | 513,120 km² |
| 13 | 🇲🇲 Myanmar | 54,849,472 | 676,590 km² |
| 14 | 🇰🇷 South Korea | 51,756,284 | 100,430 km² |
| 15 | 🇮🇶 Iraq | 46,225,266 | 435,050 km² |
| 16 | 🇦🇫 Afghanistan | 43,026,322 | 652,860 km² |
| 17 | 🇸🇦 Saudi Arabia | 37,473,929 | 2,149,690 km² |
| 18 | 🇺🇿 Uzbekistan | 35,522,965 | 448,924 km² |
| 19 | 🇾🇪 Yemen | 34,982,136 | 555,000 km² |
| 20 | 🇲🇾 Malaysia | 34,562,556 | 330,411 km² |
| 21 | 🇳🇵 Nepal | 31,136,781 | 147,180 km² |
| 22 | 🇰🇵 North Korea | 26,220,850 | 120,540 km² |
| 23 | 🇸🇾 Syria | 24,010,759 | 185,180 km² |
| 24 | 🇹🇼 Taiwan | 23,942,522 | 36,197 km² |
| 25 | 🇱🇰 Sri Lanka | 21,933,155 | 65,610 km² |
| 26 | 🇰🇿 Kazakhstan | 19,764,158 | 2,724,900 km² |
| 27 | 🇰🇭 Cambodia | 17,071,236 | 181,040 km² |
| 28 | 🇯🇴 Jordan | 11,368,898 | 89,318 km² |
| 29 | 🇦🇿 Azerbaijan | 10,448,636 | 86,600 km² |
| 30 | 🇹🇯 Tajikistan | 10,277,238 | 141,379 km² |
| 31 | 🇦🇪 UAE | 9,569,300 | 98,648 km² |
| 32 | 🇮🇱 Israel | 9,272,228 | 22,070 km² |
| 33 | 🇱🇦 Laos | 7,736,681 | 236,800 km² |
| 34 | 🇰🇬 Kyrgyzstan | 6,807,948 | 199,950 km² |
| 35 | 🇹🇲 Turkmenistan | 6,573,631 | 488,100 km² |
| 36 | 🇸🇬 Singapore | 6,119,203 | 728 km² |
| 37 | 🇵🇸 Palestine | 5,494,963 | 6,025 km² |
| 38 | 🇱🇧 Lebanon | 5,257,501 | 10,450 km² |
| 39 | 🇴🇲 Oman | 4,692,824 | 309,500 km² |
| 40 | 🇰🇼 Kuwait | 4,337,703 | 17,820 km² |
| 41 | 🇬🇪 Georgia | 3,720,477 | 69,700 km² |
| 42 | 🇲🇳 Mongolia | 3,480,040 | 1,564,116 km² |
| 43 | 🇦🇲 Armenia | 2,777,979 | 29,743 km² |
| 44 | 🇶🇦 Qatar | 2,730,864 | 11,490 km² |
| 45 | 🇧🇭 Bahrain | 1,494,745 | 790 km² |
| 46 | 🇹🇱 Timor-Leste | 1,374,025 | 14,870 km² |
| 47 | 🇨🇾 Cyprus | 1,260,138 | 9,250 km² |
| 48 | 🇧🇹 Bhutan | 790,918 | 38,390 km² |
| 49 | 🇲🇻 Maldives | 518,765 | 300 km² |
| 50 | 🇧🇳 Brunei | 454,869 | 5,770 km² |
Note: Russia and Georgia are typically regarded as European countries for cultural reasons, despite their geographic locations. They have been included in the dataset for context only.
Other countries that are covered by red: Indonesia (ranked 4th in population), Japan (ranked 7th), and the Philippines (8th), are all some of Asia’s most populous countries.
They also have some of the world’s densest cities:
- Manila: 42,857 people/km²
- Mumbai: 28,195 people/km²
- Karachi: 24,000 people/km²
- Jakarta: 14,464 people/km²
Tokyo and Beijing—despite being some of the world’s largest cities by population—record lower densities in comparison, helped by their much larger administrative areas.
But when sorted by average population density across the entire country, the ranks look a little bit different.
Ranked: Asia’s Countries By Population Density
The city state of Singapore is the densest country in Asia, with more than 8,000 people/km². Far behind it, the similarly sized in area Bahrain has one-sixth the population and ranks second (1,892/km²) in Asia’s densest countries.
| Rank | Country | Population Density |
|---|---|---|
| 1 | 🇸🇬 Singapore | 8,405 people/km2 |
| 2 | 🇧🇭 Bahrain | 1,892 people/km2 |
| 3 | 🇲🇻 Maldives | 1,729 people/km2 |
| 4 | 🇧🇩 Bangladesh | 1,180 people/km2 |
| 5 | 🇵🇸 Palestine | 912 people/km2 |
| 6 | 🇹🇼 Taiwan | 661 people/km2 |
| 7 | 🇰🇷 South Korea | 515 people/km2 |
| 8 | 🇱🇧 Lebanon | 503 people/km2 |
| 9 | 🇮🇳 India | 437 people/km2 |
| 10 | 🇮🇱 Israel | 420 people/km2 |
| 11 | 🇵🇭 Philippines | 397 people/km2 |
| 12 | 🇱🇰 Sri Lanka | 334 people/km2 |
| 13 | 🇯🇵 Japan | 325 people/km2 |
| 14 | 🇵🇰 Pakistan | 306 people/km2 |
| 15 | 🇻🇳 Vietnam | 300 people/km2 |
| 16 | 🇰🇼 Kuwait | 243 people/km2 |
| 17 | 🇶🇦 Qatar | 238 people/km2 |
| 18 | 🇰🇵 North Korea | 218 people/km2 |
| 19 | 🇳🇵 Nepal | 212 people/km2 |
| 20 | 🇨🇳 China | 149 people/km2 |
| 21 | 🇮🇩 Indonesia | 146 people/km2 |
| 22 | 🇹🇭 Thailand | 140 people/km2 |
| 23 | 🇨🇾 Cyprus | 136 people/km2 |
| 24 | 🇸🇾 Syria | 130 people/km2 |
| 25 | 🇯🇴 Jordan | 127 people/km2 |
| 26 | 🇦🇿 Azerbaijan | 120 people/km2 |
| 27 | 🇹🇷 Turkey | 110 people/km2 |
| 28 | 🇮🇶 Iraq | 106 people/km2 |
| 29 | 🇲🇾 Malaysia | 105 people/km2 |
| 30 | 🇦🇪 UAE | 97 people/km2 |
| 31 | 🇦🇲 Armenia | 94 people/km2 |
| 32 | 🇰🇭 Cambodia | 94 people/km2 |
| 33 | 🇹🇱 Timor-Leste | 92 people/km2 |
| 34 | 🇲🇲 Myanmar | 81 people/km2 |
| 35 | 🇧🇳 Brunei | 79 people/km2 |
| 36 | 🇺🇿 Uzbekistan | 79 people/km2 |
| 37 | 🇹🇯 Tajikistan | 73 people/km2 |
| 38 | 🇦🇫 Afghanistan | 66 people/km2 |
| 39 | 🇾🇪 Yemen | 63 people/km2 |
| 40 | 🇬🇪 Georgia | 54 people/km2 |
| 41 | 🇮🇷 Iran | 51 people/km2 |
| 42 | 🇰🇬 Kyrgyzstan | 34 people/km2 |
| 43 | 🇱🇦 Laos | 33 people/km2 |
| 44 | 🇧🇹 Bhutan | 21 people/km2 |
| 45 | 🇸🇦 Saudi Arabia | 17 people/km2 |
| 46 | 🇴🇲 Oman | 15 people/km2 |
| 47 | 🇹🇲 Turkmenistan | 13 people/km2 |
| 48 | 🇷🇺 Russia | 8 people/km2 |
| 49 | 🇰🇿 Kazakhstan | 7 people/km2 |
| 50 | 🇲🇳 Mongolia | 2 people/km2 |
Note: Russia and Georgia are typically regarded as European countries for cultural reasons, despite their geographic locations. They have been included in the dataset for context only.
Bangladesh, with 1,180 people/km², has the rare distinction of being a top five Asian country by both population and average population density.
Meanwhile, India is 9th in population density (437 people/km²), its large landmass bringing down the average considerably.
Similarly, China nearly breaks into the top 20 with a population density of 149 people/km². Despite its vast population, the country’s immense size presents a challenge, particularly in its western regions, which are largely inhospitable to substantial human settlement due to the presence of mountains, the Tibetan plateau, and two deserts.
At the bottom of the rankings, Mongolia (2 people/km²) and Kazakhstan (7 people/km²) are some of the least dense countries in the world.


Maps
The Largest Earthquakes in the New York Area (1970-2024)
The earthquake that shook buildings across New York in April 2024 was the third-largest quake in the Northeast U.S. over the past 50 years.


The Largest Earthquakes in the New York Area
This was originally posted on our Voronoi app. Download the app for free on Apple or Android and discover incredible data-driven charts from a variety of trusted sources.
The 4.8 magnitude earthquake that shook buildings across New York on Friday, April 5th, 2024 was the third-largest quake in the U.S. Northeast area over the past 50 years.
In this map, we illustrate earthquakes with a magnitude of 4.0 or greater recorded in the Northeastern U.S. since 1970, according to the United States Geological Survey (USGS).
Shallow Quakes and Older Buildings
The earthquake that struck the U.S. Northeast in April 2024 was felt by millions of people from Washington, D.C., to north of Boston. It even caused a full ground stop at Newark Airport.
The quake, occurring just 5 km beneath the Earth’s surface, was considered shallow, which is what contributed to more intense shaking at the surface.
According to the USGS, rocks in the eastern U.S. are significantly older, denser, and harder than those on the western side, compressed by time. This makes them more efficient conduits for seismic energy. Additionally, buildings in the Northeast tend to be older and may not adhere to the latest earthquake codes.
Despite disrupting work and school life, the earthquake was considered minor, according to the Michigan Technological University magnitude scale:
| Magnitude | Earthquake Effects | Estimated Number Each Year |
|---|---|---|
| 2.5 or less | Usually not felt, but can be recorded by seismograph. | Millions |
| 2.5 to 5.4 | Often felt, but only causes minor damage. | 500,000 |
| 5.5 to 6.0 | Slight damage to buildings and other structures. | 350 |
| 6.1 to 6.9 | May cause a lot of damage in very populated areas. | 100 |
| 7.0 to 7.9 | Major earthquake. Serious damage. | 10-15 |
| 8.0 or greater | Great earthquake. Can totally destroy communities near the epicenter. | One every year or two |
The largest earthquake felt in the area over the past 50 years was a 5.3 magnitude quake that occurred in Au Sable Forks, New York, in 2002. It damaged houses and cracked roads in a remote corner of the Adirondack Mountains, but caused no injuries.
| Date | Magnitude | Location | State |
|---|---|---|---|
| April 20, 2002 | 5.3 | Au Sable Forks | New York |
| October 7, 1983 | 5.1 | Newcomb | New York |
| April 5, 2024 | 4.8 | Whitehouse Station | New Jersey |
| October 16, 2012 | 4.7 | Hollis Center | Maine |
| January 16, 1994 | 4.6 | Sinking Spring | Pennsylvania |
| January 19, 1982 | 4.5 | Sanbornton | New Hampshire |
| September 25, 1998 | 4.5 | Adamsville | Pennsylvania |
| June 9, 1975 | 4.2 | Altona | New York |
| May 29, 1983 | 4.2 | Peru | Maine |
| April 23, 1984 | 4.2 | Conestoga | Pennsylvania |
| January 16, 1994 | 4.2 | Sinking Spring | Pennsylvania |
| November 3, 1975 | 4 | Long Lake | New York |
| June 17, 1991 | 4 | Worcester | New York |
The largest earthquake in U.S. history, however, was the 1964 Good Friday quake in Alaska, measuring 9.2 magnitude and killing 131 people.

-

 Education1 week ago
How Hard Is It to Get Into an Ivy League School?
-

 Technology2 weeks ago
Ranked: Semiconductor Companies by Industry Revenue Share
-

 Markets2 weeks ago
Ranked: The World’s Top Flight Routes, by Revenue
-

 Demographics2 weeks ago
Population Projections: The World’s 6 Largest Countries in 2075
-

 Markets2 weeks ago
The Top 10 States by Real GDP Growth in 2023
-

 Demographics2 weeks ago
The Smallest Gender Wage Gaps in OECD Countries
-

 Economy2 weeks ago
Where U.S. Inflation Hit the Hardest in March 2024
-

 Environment2 weeks ago
Top Countries By Forest Growth Since 2001