Economy
Where U.S. Inflation Hit the Hardest in March 2024
![]() See this visualization first on the Voronoi app.
See this visualization first on the Voronoi app.
Where U.S. Inflation Hit the Hardest (March 2024)
This was originally posted on our Voronoi app. Download the app for free on iOS or Android and discover incredible data-driven charts from a variety of trusted sources.
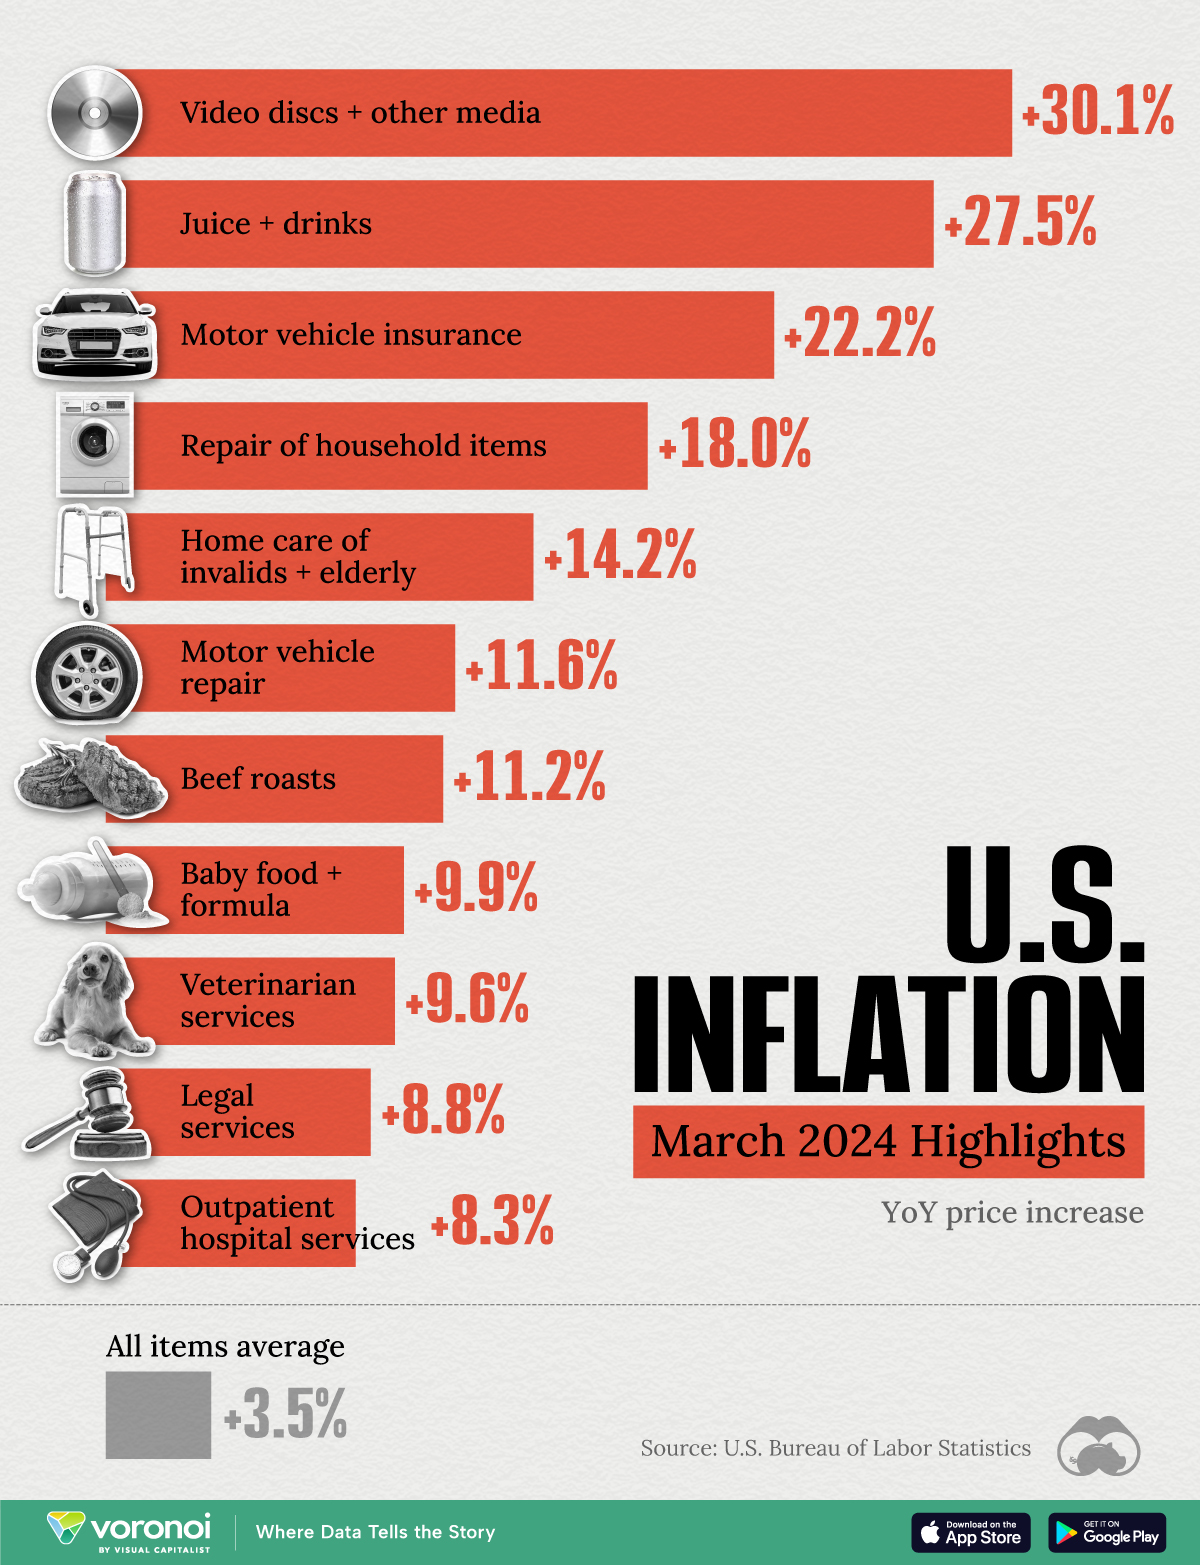
The latest U.S. inflation figures were released in early April, revealing that the consumer price index (CPI) had risen by 3.5% in March 2024, on an annual basis. This is unfortunately higher than the 3.2% logged in February, showing once again how stubborn inflation has been post-pandemic.
To add context to these figures, we’ve visualized CPI categories that became significantly more expensive from March 2023 to March 2024. All figures come from the U.S. Bureau of Labor Statistics, which regularly posts CPI figures.
Data and Highlights
The data we used to create this graphic is listed in the table below.
| Item | YoY Change (%) |
|---|---|
| 📀 Video discs + other media | 30.1 |
| 🥤 Juice + drinks | 27.5 |
| 🚗 Motor vehicle insurance | 22.2 |
| 🔧 Repair of household items | 18 |
| 🏠 Home care of invalids + elderly | 14.2 |
| 🚗 Motor vehicle repair | 11.6 |
| 🥩 Beef roasts | 11.2 |
| 👶 Baby food + formula | 9.9 |
| 🐾 Veterinarian services | 9.6 |
| ⚖️ Legal services | 8.8 |
| 🏥 Outpatient hospital services | 8.3 |
| 📊 All items average | 3.5 |
Prices of “video discs and other media” rose by a substantial 30.1% year-over-year as of March 2024, highlighting rising demand for physical media such as vinyl records.
According to an article from The Guardian, U.S. vinyl sales rose 21.7% in the first half of 2023, driven by artists like Taylor Swift, Lana Del Rey, and Fleetwood Mac. Swift’s latest album, Midnights, sold nearly 500,000 vinyl copies throughout the entire year.
Another category that rose significantly was “juice and drinks”, at 27.5%. This rise in cost has been attributed to numerous factors including sugar shortages, increased transportation costs, and diseases affecting orange trees in Florida.
See more graphics on inflation
If you enjoyed this post, check out this graphic on inflation rates across the G20. For each country, we compared inflation rates in February 2024 to their COVID-19 peak.


Markets
The Best U.S. Companies to Work for According to LinkedIn
We visualized the results of a LinkedIn study on the best U.S. companies to work for in 2024.
The Best U.S. Companies to Work for According to LinkedIn
This was originally posted on our Voronoi app. Download the app for free on iOS or Android and discover incredible data-driven charts from a variety of trusted sources.
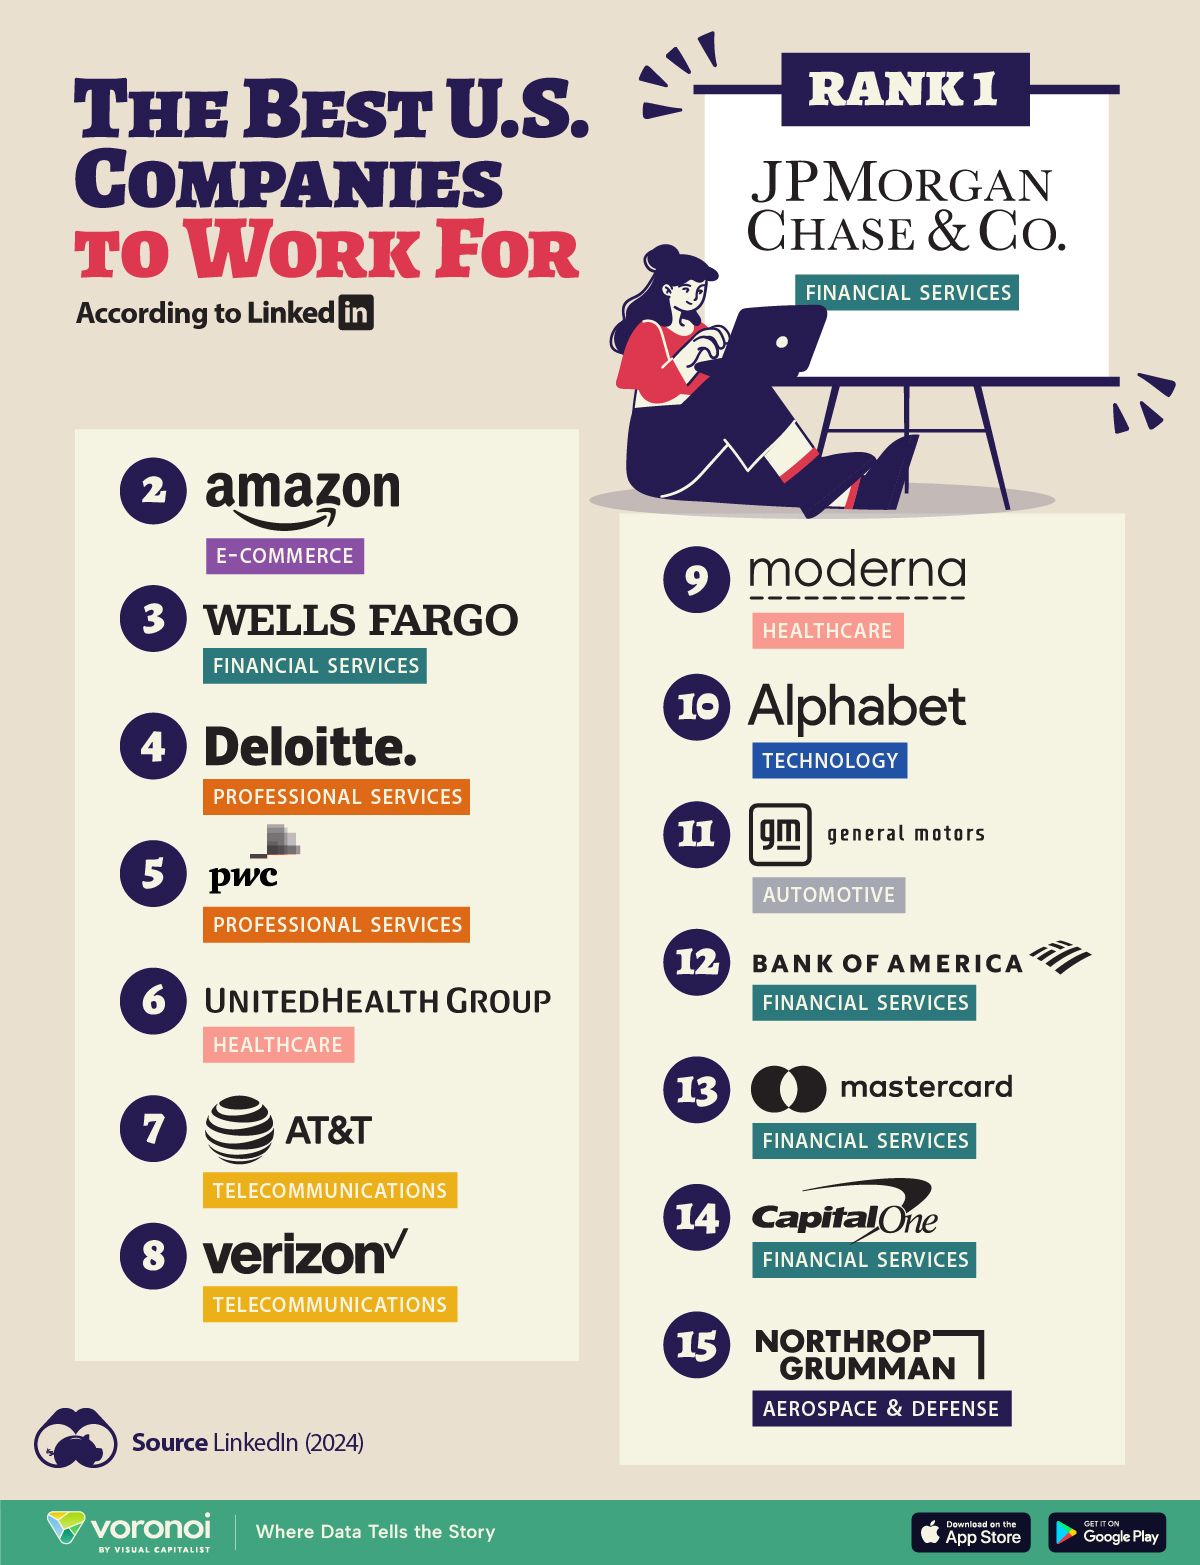
In this graphic, we list the 15 best U.S. companies to work for in 2024, according to LinkedIn data.
LinkedIn ranked companies based on eight pillars: ability to advance, skills growth, company stability, external opportunity, company affinity, gender diversity, educational background, and employee presence in the country.
To be eligible, companies must have had 5,000 or more global employees, with at least 500 in the country as of December 31, 2023.
Data and Highlights
Financial institutions dominate the ranking of the best U.S. companies to work for in 2024, with JP Morgan Chase & Co. ranking first.
| Rank | Company | Industry |
|---|---|---|
| 1 | JP Morgan Chase & Co. | Financial Services |
| 2 | Amazon | E-commerce |
| 3 | Wells Fargo | Financial Services |
| 4 | Deloitte | Professional Services |
| 5 | PwC | Professional Services |
| 6 | UnitedHealth Group | Healthcare |
| 7 | AT&T | Telecommunications |
| 8 | Verizon | Telecommunications |
| 9 | Moderna | Pharmaceuticals |
| 10 | Alphabet Inc. | Technology |
| 11 | General Motors | Automotive |
| 12 | Bank of America | Financial Services |
| 13 | Mastercard | Financial Services |
| 14 | Capital One | Financial Services |
| 15 | Northrop Grumman | Aerospace & Defense |
J.P. Morgan has a program that offers opportunities for candidates without a university degree. In fact, in 2022, 75% of job descriptions at the bank for experienced hires did not require a college degree.
Meanwhile, Deloitte and Amazon offer a variety of free training courses, including in AI.
Moderna includes in its employee package benefits to help avoid employee burnout — from subsidized commuter expenses and pop-up daycare centers, to wellness coaches.
Mastercard offers flexible work availability, with 11.5% remote and 89% hybrid options.
It’s also interesting to note that only Amazon and Alphabet made the cut from the ‘Magnificent Seven’ companies (Apple, Microsoft, Google parent Alphabet, Amazon, Nvidia, Meta Platforms, and Tesla).
See more about the best companies to work for in this infographic, which covers a separate ranking from Glassdoor.

-

 Demographics6 days ago
The Countries That Have Become Sadder Since 2010
-

 Green2 weeks ago
Ranked: The Countries With the Most Air Pollution in 2023
-

 Green2 weeks ago
Ranking the Top 15 Countries by Carbon Tax Revenue
-

 Markets2 weeks ago
U.S. Debt Interest Payments Reach $1 Trillion
-

 Mining2 weeks ago
Gold vs. S&P 500: Which Has Grown More Over Five Years?
-

 Energy2 weeks ago
The World’s Biggest Nuclear Energy Producers
-

 Misc2 weeks ago
How Hard Is It to Get Into an Ivy League School?
-

 Debt2 weeks ago
How Debt-to-GDP Ratios Have Changed Since 2000