Maps
Mapped: Average Wages Across Europe
![]() See this visualization first on the Voronoi app.
See this visualization first on the Voronoi app.
Mapped: Average Wages Across Europe
This was originally posted on our Voronoi app. Download the app for free on Apple or Android and discover incredible data-driven charts from a variety of trusted sources.
Much and more has been written about the best countries in Europe to visit, sight-see at, or vacation in.
But the economic powerhouse of a continent also has eight of the top 20 largest economies, the biggest single-market area, and some of the richest countries in the world.
How does all of that translate into how much people earn across the continent?
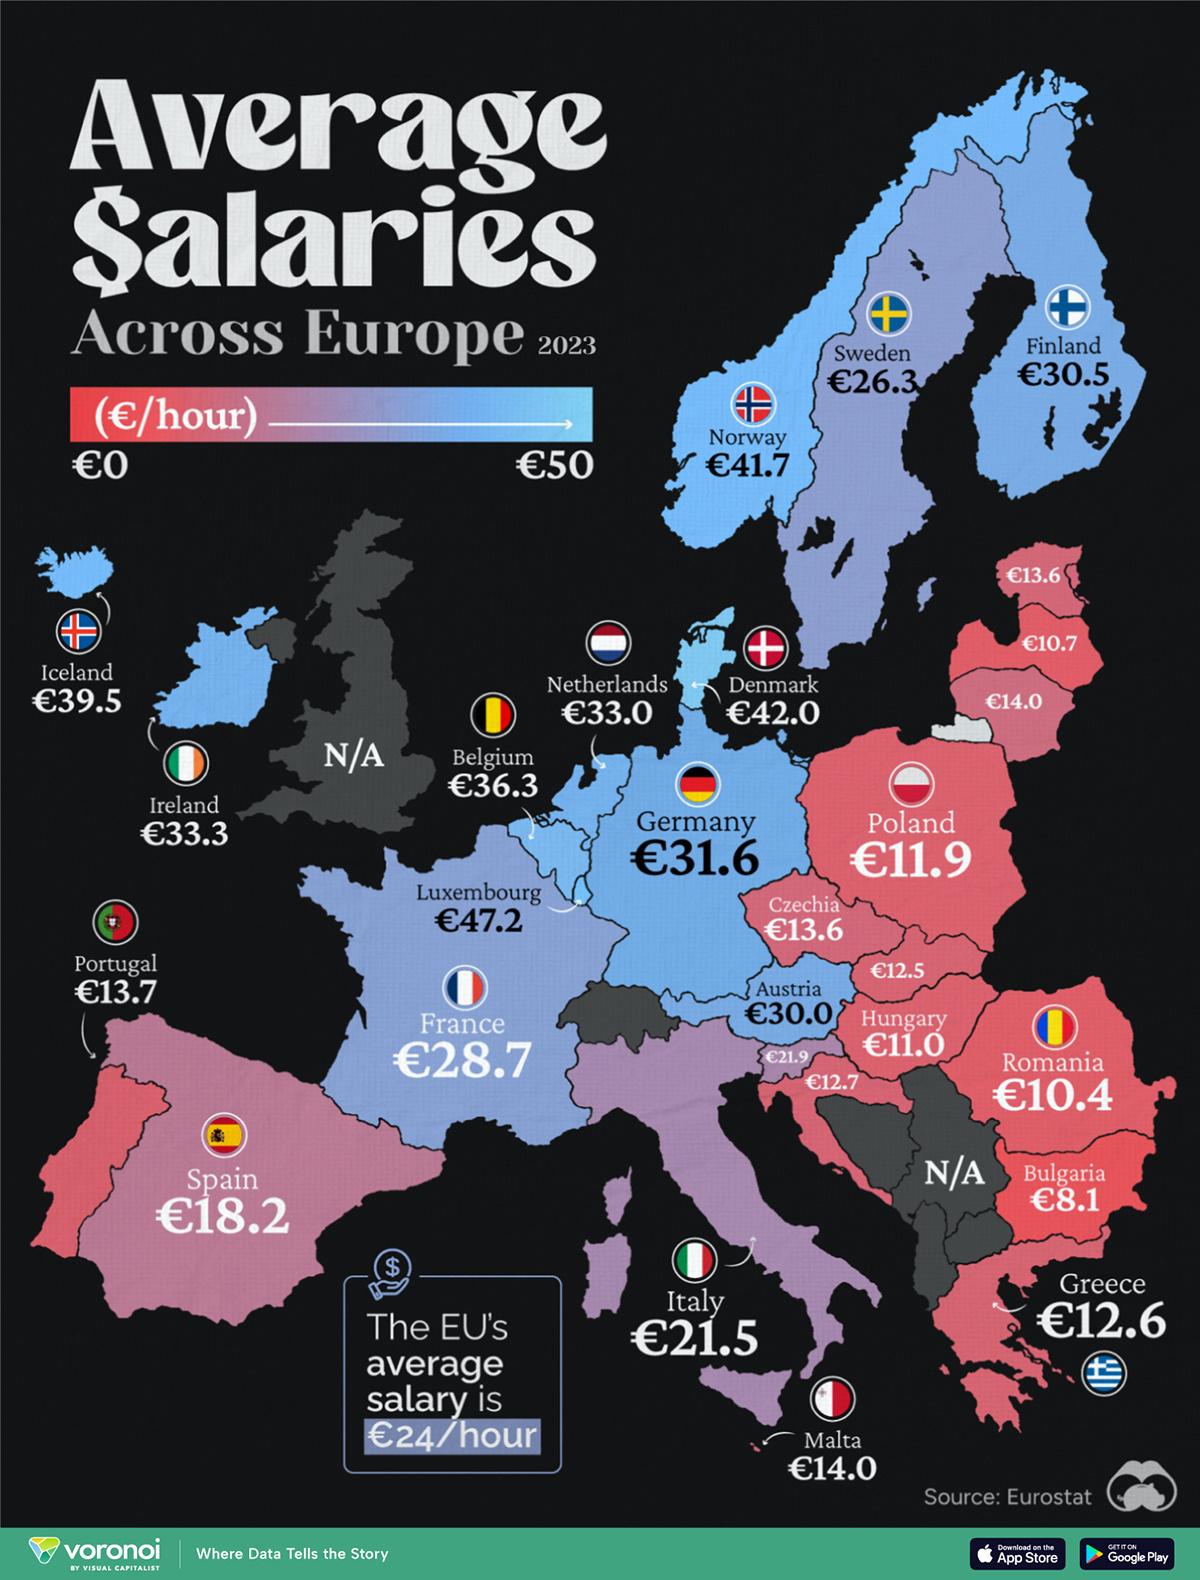
We visualize the average hourly salary (in euros), across Europe in a heatmap. The bluer the hue, the higher the hourly salary. Data for this visualization comes from Eurostat and is current up to 2023.
Ranked: European Countries By Average Hourly Salaries
Luxembourg, Europe’s financial services capital, has the highest average salary (€47/hour) across the continent. The country also has the highest per capita GDP in the world.
Scandinavia’s Denmark and Norway also pay higher (€42/hour) though Sweden (€26/hour) falls more in the middle of the pack.
| Rank | Country | Average Salary (€/hour) |
|---|---|---|
| 1 | 🇱🇺 Luxembourg | €47.2 |
| 2 | 🇩🇰 Denmark | €42.0 |
| 3 | 🇳🇴 Norway | €41.7 |
| 4 | 🇮🇸 Iceland | €39.5 |
| 5 | 🇧🇪 Belgium | €36.3 |
| 6 | 🇮🇪 Ireland | €33.3 |
| 7 | 🇳🇱 Netherlands | €33.0 |
| 8 | 🇩🇪 Germany | €31.6 |
| 9 | 🇫🇮 Finland | €30.5 |
| 10 | 🇦🇹 Austria | €30.0 |
| 11 | 🇫🇷 France | €28.7 |
| 12 | 🇸🇪 Sweden | €26.3 |
| 13 | 🇸🇮 Slovenia | €21.9 |
| 14 | 🇮🇹 Italy | €21.5 |
| 15 | 🇪🇸 Spain | €18.2 |
| 16 | 🇨🇾 Cyprus | €16.3 |
| 17 | 🇱🇹 Lithuania | €14.0 |
| 18 | 🇲🇹 Malta | €14.0 |
| 19 | 🇵🇹 Portugal | €13.7 |
| 20 | 🇨🇿 Czechia | €13.6 |
| 21 | 🇪🇪 Estonia | €13.6 |
| 22 | 🇭🇷 Croatia | €12.7 |
| 23 | 🇬🇷 Greece | €12.6 |
| 24 | 🇸🇰 Slovakia | €12.5 |
| 25 | 🇵🇱 Poland | €11.9 |
| 26 | 🇭🇺 Hungary | €11.0 |
| 27 | 🇱🇻 Latvia | €10.7 |
| 28 | 🇷🇴 Romania | €10.4 |
| 29 | 🇧🇬 Bulgaria | €8.1 |
| N/A | 🇪🇺 EU | €24.0 |
Note: The source has not provided data for Russia, the UK, Switzerland, Serbia, Bosnia & Herzegovina, Liechtenstein, Andorra, San Marino, Monaco, and Vatican City.
Bulgaria records the lowest average salary in this dataset at €8/hour.
The map indicates Northern and Western Europe have higher average wages than Southern and Eastern Europe, reflecting the differences in economic development and wealth.
However, this split has not always been present. In fact, the reverse was true for many centuries. Mediterranean-based civilizations used to be some of the wealthiest in the world, benefiting greatly from the sea’s access across to Northern Africa and the Levant.
But by the 16th and 17th centuries, Atlantic Ocean trade opened up access to far bigger markets, driving up economic growth and wealth accumulation for the western half of Europe.
Naturally, the map of average salaries is also a reflection of the cost of living as well, influencing purchasing power, lifestyle choices, and overall economic conditions for individuals and families.


Maps
The Largest Earthquakes in the New York Area (1970-2024)
The earthquake that shook buildings across New York in April 2024 was the third-largest quake in the Northeast U.S. over the past 50 years.


The Largest Earthquakes in the New York Area
This was originally posted on our Voronoi app. Download the app for free on Apple or Android and discover incredible data-driven charts from a variety of trusted sources.
The 4.8 magnitude earthquake that shook buildings across New York on Friday, April 5th, 2024 was the third-largest quake in the U.S. Northeast area over the past 50 years.
In this map, we illustrate earthquakes with a magnitude of 4.0 or greater recorded in the Northeastern U.S. since 1970, according to the United States Geological Survey (USGS).
Shallow Quakes and Older Buildings
The earthquake that struck the U.S. Northeast in April 2024 was felt by millions of people from Washington, D.C., to north of Boston. It even caused a full ground stop at Newark Airport.
The quake, occurring just 5 km beneath the Earth’s surface, was considered shallow, which is what contributed to more intense shaking at the surface.
According to the USGS, rocks in the eastern U.S. are significantly older, denser, and harder than those on the western side, compressed by time. This makes them more efficient conduits for seismic energy. Additionally, buildings in the Northeast tend to be older and may not adhere to the latest earthquake codes.
Despite disrupting work and school life, the earthquake was considered minor, according to the Michigan Technological University magnitude scale:
| Magnitude | Earthquake Effects | Estimated Number Each Year |
|---|---|---|
| 2.5 or less | Usually not felt, but can be recorded by seismograph. | Millions |
| 2.5 to 5.4 | Often felt, but only causes minor damage. | 500,000 |
| 5.5 to 6.0 | Slight damage to buildings and other structures. | 350 |
| 6.1 to 6.9 | May cause a lot of damage in very populated areas. | 100 |
| 7.0 to 7.9 | Major earthquake. Serious damage. | 10-15 |
| 8.0 or greater | Great earthquake. Can totally destroy communities near the epicenter. | One every year or two |
The largest earthquake felt in the area over the past 50 years was a 5.3 magnitude quake that occurred in Au Sable Forks, New York, in 2002. It damaged houses and cracked roads in a remote corner of the Adirondack Mountains, but caused no injuries.
| Date | Magnitude | Location | State |
|---|---|---|---|
| April 20, 2002 | 5.3 | Au Sable Forks | New York |
| October 7, 1983 | 5.1 | Newcomb | New York |
| April 5, 2024 | 4.8 | Whitehouse Station | New Jersey |
| October 16, 2012 | 4.7 | Hollis Center | Maine |
| January 16, 1994 | 4.6 | Sinking Spring | Pennsylvania |
| January 19, 1982 | 4.5 | Sanbornton | New Hampshire |
| September 25, 1998 | 4.5 | Adamsville | Pennsylvania |
| June 9, 1975 | 4.2 | Altona | New York |
| May 29, 1983 | 4.2 | Peru | Maine |
| April 23, 1984 | 4.2 | Conestoga | Pennsylvania |
| January 16, 1994 | 4.2 | Sinking Spring | Pennsylvania |
| November 3, 1975 | 4 | Long Lake | New York |
| June 17, 1991 | 4 | Worcester | New York |
The largest earthquake in U.S. history, however, was the 1964 Good Friday quake in Alaska, measuring 9.2 magnitude and killing 131 people.

-

 Demographics6 days ago
The Countries That Have Become Sadder Since 2010
-

 Green2 weeks ago
Ranked: The Countries With the Most Air Pollution in 2023
-

 Green2 weeks ago
Ranking the Top 15 Countries by Carbon Tax Revenue
-

 Markets2 weeks ago
U.S. Debt Interest Payments Reach $1 Trillion
-

 Mining2 weeks ago
Gold vs. S&P 500: Which Has Grown More Over Five Years?
-

 Energy2 weeks ago
The World’s Biggest Nuclear Energy Producers
-

 Misc2 weeks ago
How Hard Is It to Get Into an Ivy League School?
-

 Debt2 weeks ago
How Debt-to-GDP Ratios Have Changed Since 2000