Environment
Ranked: Top Countries by Total Forest Loss Since 2001
![]() See this visualization first on the Voronoi app.
See this visualization first on the Voronoi app.
Ranked: Top Countries By Total Forest Loss Since 2001
This was originally posted on our Voronoi app. Download the app for free on iOS or Android and discover incredible data-driven charts from a variety of trusted sources.
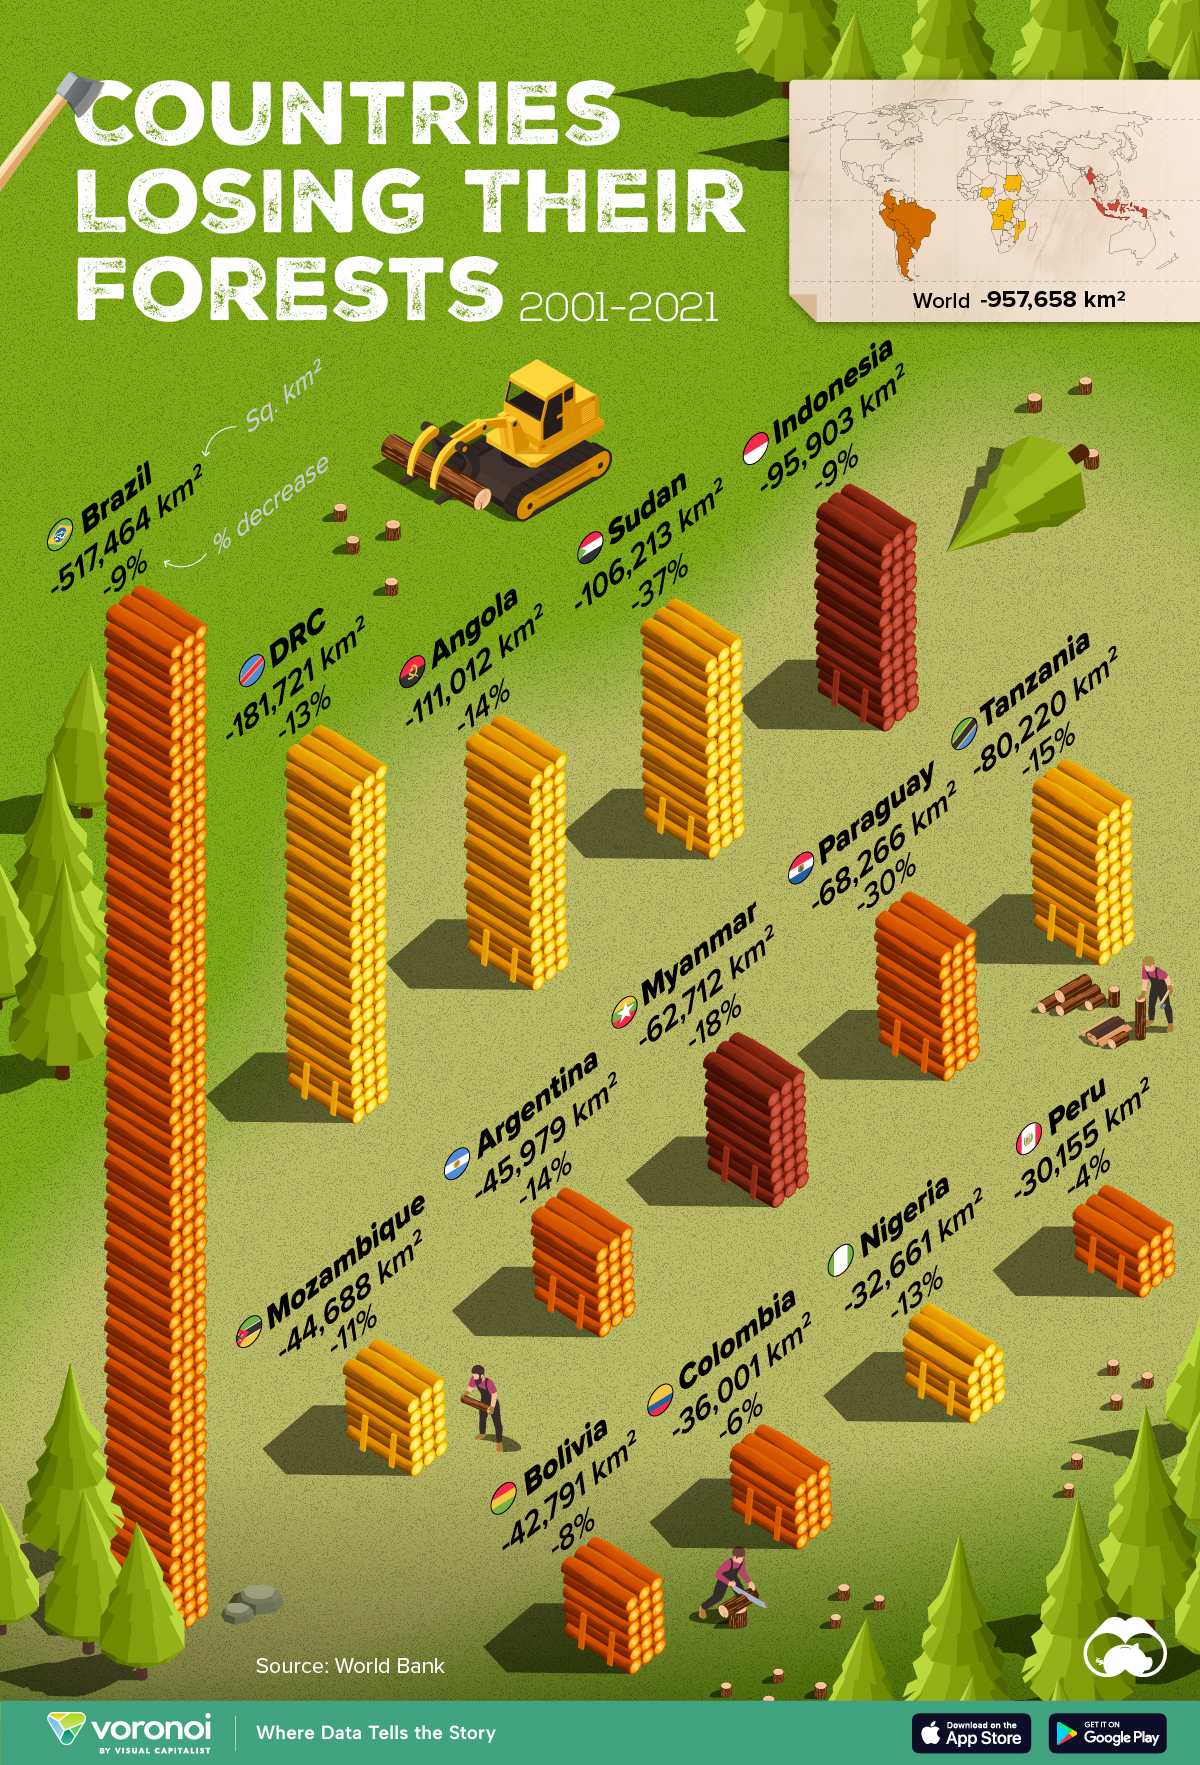
Forests are critical natural resources, often caught in the crosshairs of economic development. Thanks to expanding human settlement, agriculture, and industry, the world lost nearly 1 million square kilometers (km²) of forest cover since 2001.
But where has most of this deforestation occurred?
We rank the countries by the total decrease in their forest area between 2001 and 2021, measured in square kilometers along with their percentage decrease for context. All of this data was sourced from the World Bank.
A caveat to this data: countries are ranked by total forest loss, so countries with the largest forests feature predominantly on this list.
Which Country Has Lost the Most Forests (2001-2021)?
Brazil has lost more than half a million square kilometers of forest in the last two decades. Agricultural expansion for beef and soy production alongside mining and infrastructure growth are the primary drivers behind this large scale deforestation.
This has also caused periodic fires in the Amazon rainforest, drawing repeated alarm from around the world. In fact, Brazil has lost as much forest cover as the next four countries combined.
The table below lists the countries included in this graphic, as well as several others further down the ranking.
| Rank | Country | Region | 2001–21 Change (in km2) | % of Forest Loss |
|---|---|---|---|---|
| 1 | 🇧🇷 Brazil | South America | -517,464 | -9% |
| 2 | 🇨🇩 DRC | Africa | -181,721 | -13% |
| 3 | 🇦🇴 Angola | Africa | -111,012 | -14% |
| 4 | 🇸🇩 Sudan | Africa | -106,213 | -37% |
| 5 | 🇮🇩 Indonesia | Asia | -95,903 | -9% |
| 6 | 🇹🇿 Tanzania | Africa | -80,220 | -15% |
| 7 | 🇵🇾 Paraguay | South America | -68,266 | -30% |
| 8 | 🇲🇲 Myanmar | Asia | -62,712 | -18% |
| 9 | 🇦🇷 Argentina | South America | -45,979 | -14% |
| 10 | 🇲🇿 Mozambique | Africa | -44,688 | -11% |
| 11 | 🇧🇴 Bolivia | South America | -42,791 | -8% |
| 12 | 🇨🇴 Colombia | South America | -36,001 | -6% |
| 13 | 🇳🇬 Nigeria | Africa | -32,661 | -13% |
| 14 | 🇵🇪 Peru | South America | -30,155 | -4% |
| 15 | 🇰🇭 Cambodia | Asia | -28,491 | -26% |
| 16 | 🇻🇪 Venezuela | South America | -28,130 | -6% |
| 17 | 🇲🇽 Mexico | North America | -26,732 | -4% |
| 18 | 🇿🇲 Zambia | Africa | -23,924 | -5% |
| 19 | 🇧🇼 Botswana | Africa | -23,660 | -14% |
| 20 | 🇨🇮 Cote d'Ivoire | Africa | -22,577 | -45% |
What is quickly apparent is how most of the countries on this list are from Africa and South America. A study found a correlation where developing economies tend to have higher deforestation rates than advanced economies. Former colonies have also experienced more forest loss than those that were not colonized.
In Asia, Indonesia’s burgeoning palm oil industry is a key driver to deforestation, though efforts are now being made to reverse its impact. Meanwhile, Cambodia experienced rapid clear-cutting for its growing rubber plantations and timber industry.
Finally, Myanmar has long contended with illegal logging, but the country’s ongoing civil war is styming conversation efforts.


Environment
How Carbon Dioxide Removal is Critical to a Net-Zero Future
Here’s how carbon dioxide removal methods could help us meet net-zero targets and and stabilize the climate.
How Carbon Dioxide Removal is Critical to a Net-Zero Future
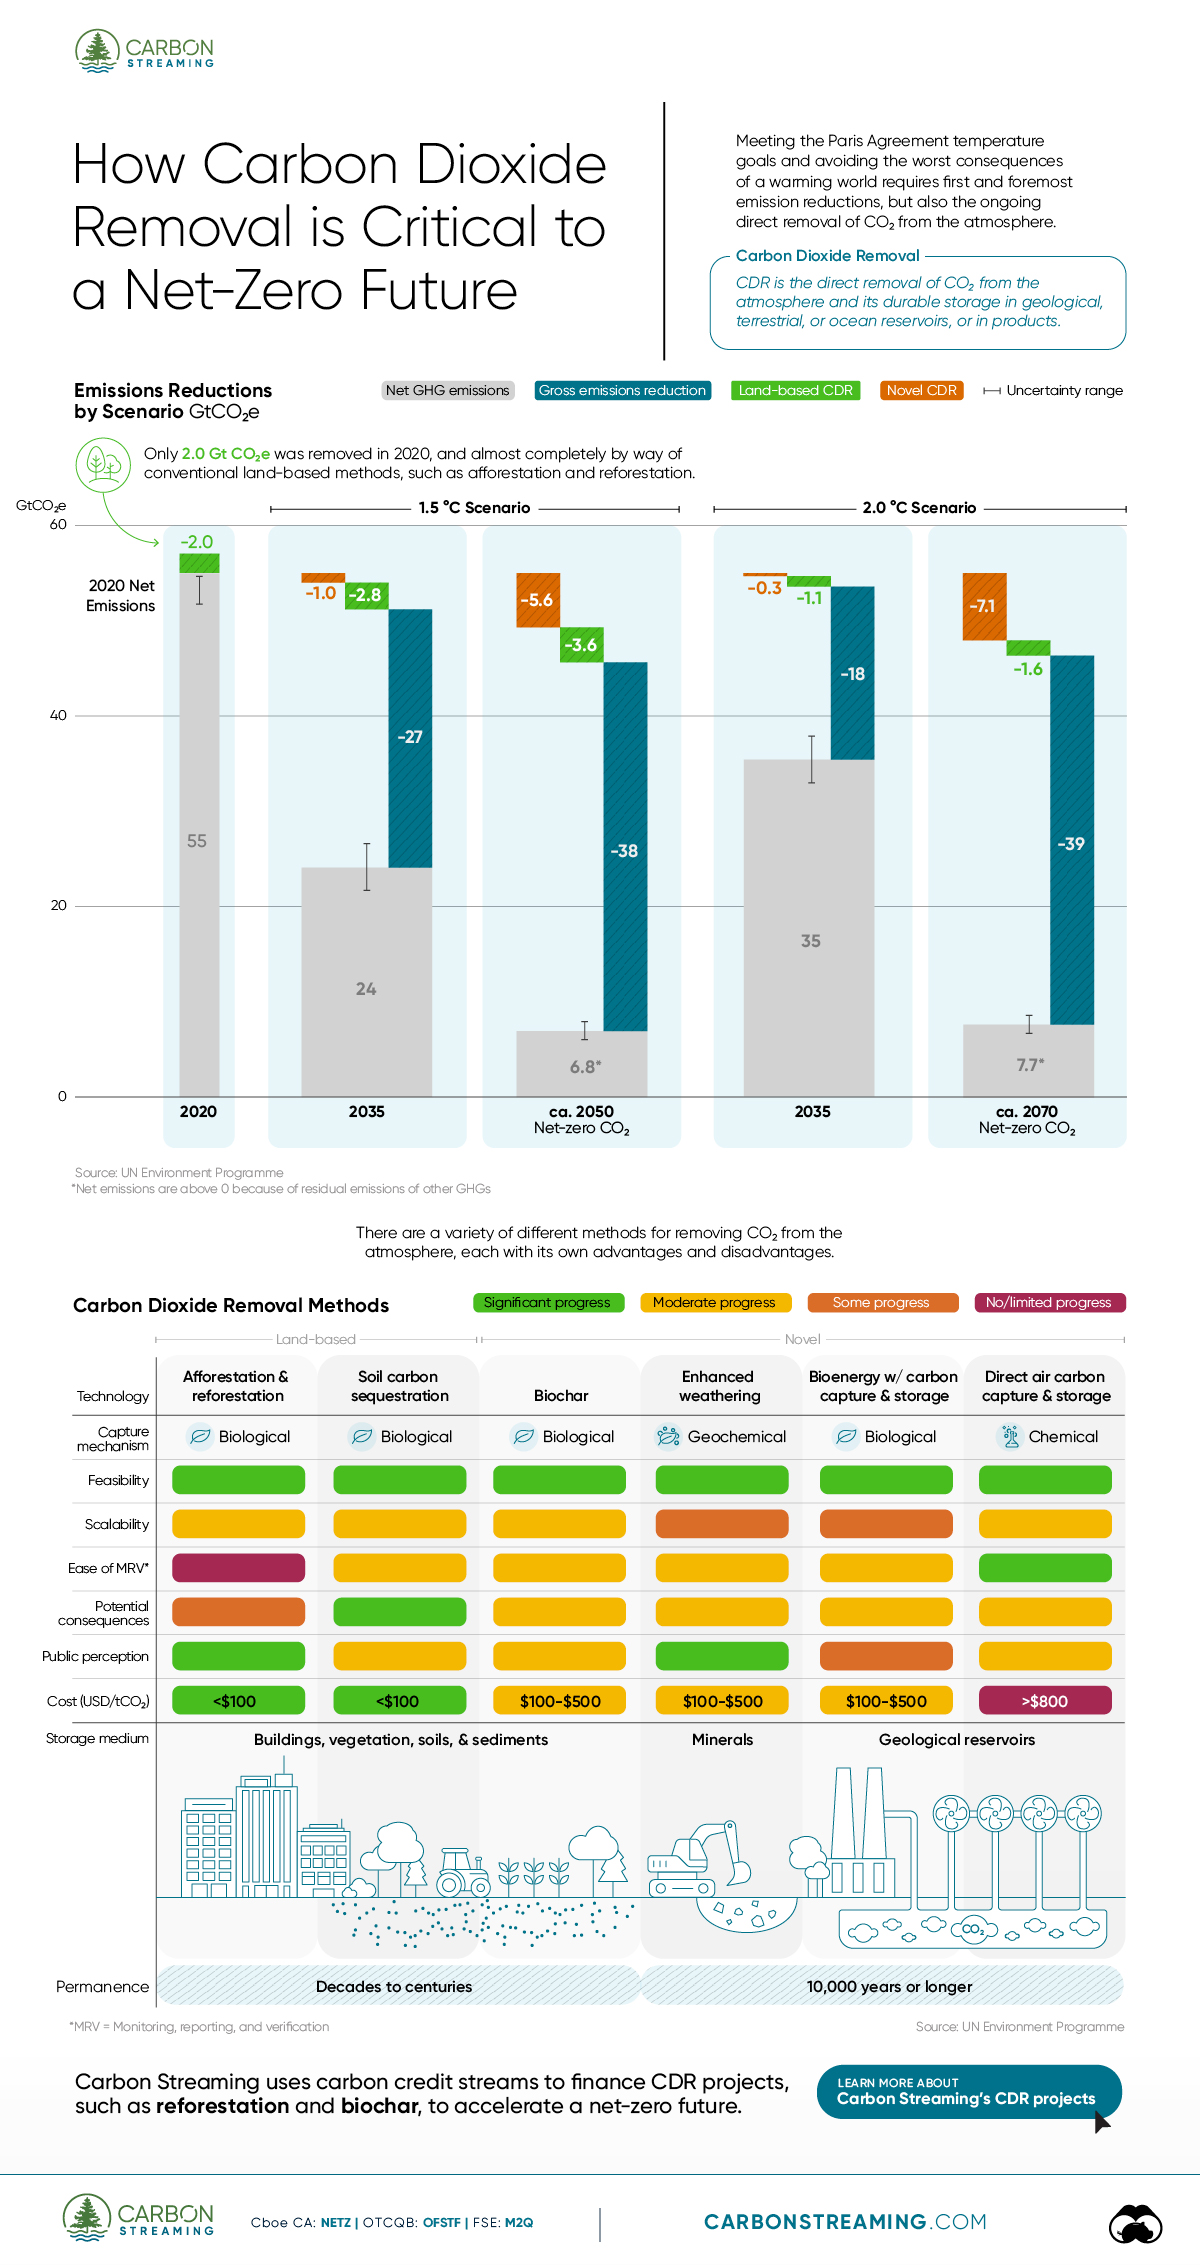
Meeting the Paris Agreement temperature goals and avoiding the worst consequences of a warming world requires first and foremost emission reductions, but also the ongoing direct removal of CO2 from the atmosphere.
We’ve partnered with Carbon Streaming to take a deep look at carbon dioxide removal methods, and the role that they could play in a net-zero future.
What is Carbon Dioxide Removal?
Carbon Dioxide Removal, or CDR, is the direct removal of CO2 from the atmosphere and its durable storage in geological, terrestrial, or ocean reservoirs, or in products.
And according to the UN Environment Programme, all least-cost pathways to net zero that are consistent with the Paris Agreement have some role for CDR. In a 1.5°C scenario, in addition to emissions reductions, CDR will need to pull an estimated 3.8 GtCO2e p.a. out of the atmosphere by 2035 and 9.2 GtCO2e p.a. by 2050.
The ‘net’ in net zero is an important quantifier here, because there will be some sectors that can’t decarbonize, especially in the near term. This includes things like shipping and concrete production, where there are limited commercially viable alternatives to fossil fuels.
Not All CDR is Created Equal
There are a whole host of proposed ways for removing CO2 from the atmosphere at scale, which can be divided into land-based and novel methods, and each with their own pros and cons.
Land-based methods, like afforestation and reforestation and soil carbon sequestration, tend to be the cheapest options, but don’t tend to store the carbon for very long—just decades to centuries.
In fact, afforestation and reforestation—basically planting lots of trees—is already being done around the world and in 2020, was responsible for removing around 2 GtCO2e. And while it is tempting to think that we can plant our way out of climate change, think that the U.S. would need to plant a forest the size of New Mexico every year to cancel out their emissions.
On the other hand, novel methods like enhanced weathering and direct air carbon capture and storage, because they store carbon in minerals and geological reservoirs, can keep carbon sequestered for tens of thousand years or longer. The trade off is that these methods can be very expensive—between $100-500 and north of $800 per metric ton.
CDR Has a Critical Role to Play
In the end, there is no silver bullet, and given that 2023 was the hottest year on record—1.45°C above pre-industrial levels—it’s likely that many different CDR methods will end up playing a part, depending on local circumstances.
And not just in the drive to net zero, but also in the years after 2050, as we begin to stabilize global average temperatures and gradually return them to pre-industrial norms.
Carbon Streaming uses carbon credit streams to finance CDR projects, such as reforestation and biochar, to accelerate a net-zero future.
Learn more about Carbon Streaming’s CDR projects.

-

 Environment3 weeks ago
Ranked: Top Countries by Total Forest Loss Since 2001
The country with the most forest loss since 2001 lost as much forest cover as the next four countries combined.
-

 Environment2 months ago
Charted: Share of World Forests by Country
We visualize which countries have the biggest share of world forests by area—and while country size plays a factor, so too, does the environment.
-

 Green3 months ago
Which Countries Have the Largest Forests?
Together, the top five countries with the largest forests account for more than half of the world’s entire forest cover.
-

 Healthcare4 months ago
Visualized: What Lives in Your Gut Microbiome?
The human gut microbiome contains a world of microbes. We look at the the bacteria that deeply affect our health and well-being.
-

 Green5 months ago
Mapped: Global Temperature Rise by Country (2022-2100P)
In this set of three maps, we show the global temperature rise on a national level for 2022, 2050, and 2100 based on an analysis by…
-

 Environment5 months ago
Ranked: Per Capita Carbon Emissions by Country
Which countries rank the highest in per capita carbon emissions, and how do they impact the world’s total carbon emissions?


-

 Demographics6 days ago
The Countries That Have Become Sadder Since 2010
-

 Green2 weeks ago
Ranked: The Countries With the Most Air Pollution in 2023
-

 Green2 weeks ago
Ranking the Top 15 Countries by Carbon Tax Revenue
-

 Markets2 weeks ago
U.S. Debt Interest Payments Reach $1 Trillion
-

 Mining2 weeks ago
Gold vs. S&P 500: Which Has Grown More Over Five Years?
-

 Energy2 weeks ago
The World’s Biggest Nuclear Energy Producers
-

 Misc2 weeks ago
How Hard Is It to Get Into an Ivy League School?
-

 Debt2 weeks ago
How Debt-to-GDP Ratios Have Changed Since 2000