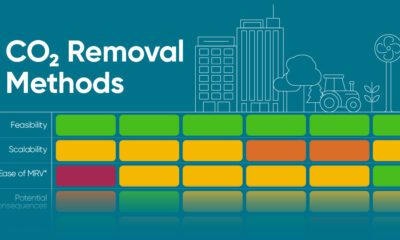

Here's how carbon dioxide removal methods could help us meet net-zero targets and and stabilize the climate.
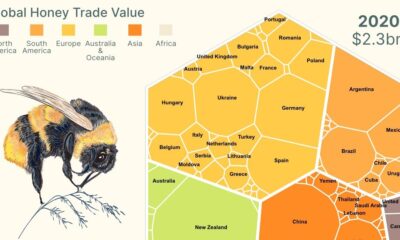

This infographic breaks down global honey exports and shows the power of Mānuka honey exports from New Zealand.
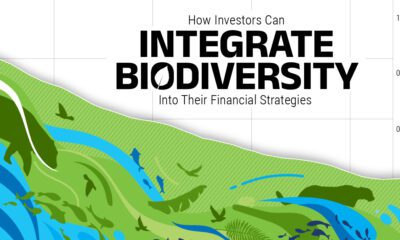

Despite contributing over half of global GDP, biodiversity is under severe pressure, and key species and ecosystems continue to be lost.
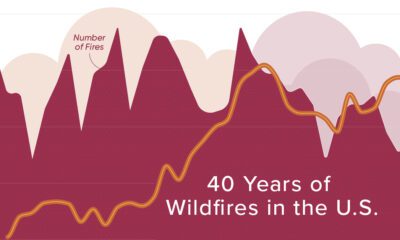

Wildfires are blazing across the U.S with unprecedented intensity. Here is how activity has evolved over four decades.
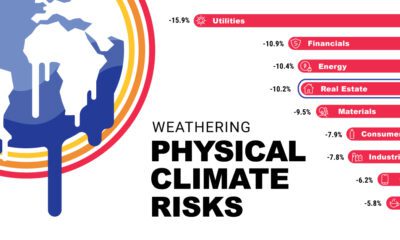

Physical hazards like fires pose climate risks for companies, due to the added costs of asset damage and business interruption.


Here are global risk projections for 2024 as tensions in the Middle East escalate and major economies face elections this year.


We visualize global CO2 emissions by income group, showing the impact of different wealth brackets on carbon generation.
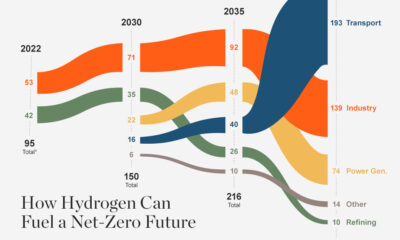

In the race to net zero, demand for hydrogen could increase to 430 Mt p.a. by 2050, but will supply be there when the world needs...


In this set of three maps, we show the global temperature rise on a national level for 2022, 2050, and 2100 based on an analysis by...


In this graphic, we visualize whether major electricity-consuming countries are on track to meet their 2030 renewable energy targets.


 Creator Program