40 Years of U.S. Wildfires, in One Chart
Note: This infographic contains forward looking information based on current expectations and beliefs of Carbon Streaming Corporation. For further information about the risks, uncertainties and assumptions related to such forward looking information, please see their legal notice.
40 Years of U.S. Wildfires, in One Chart
Wildfires are becoming more intense and widespread—largely due to rising temperatures caused by climate change.
What’s more, experts predict a whopping 50% surge in wildfires by 2100.
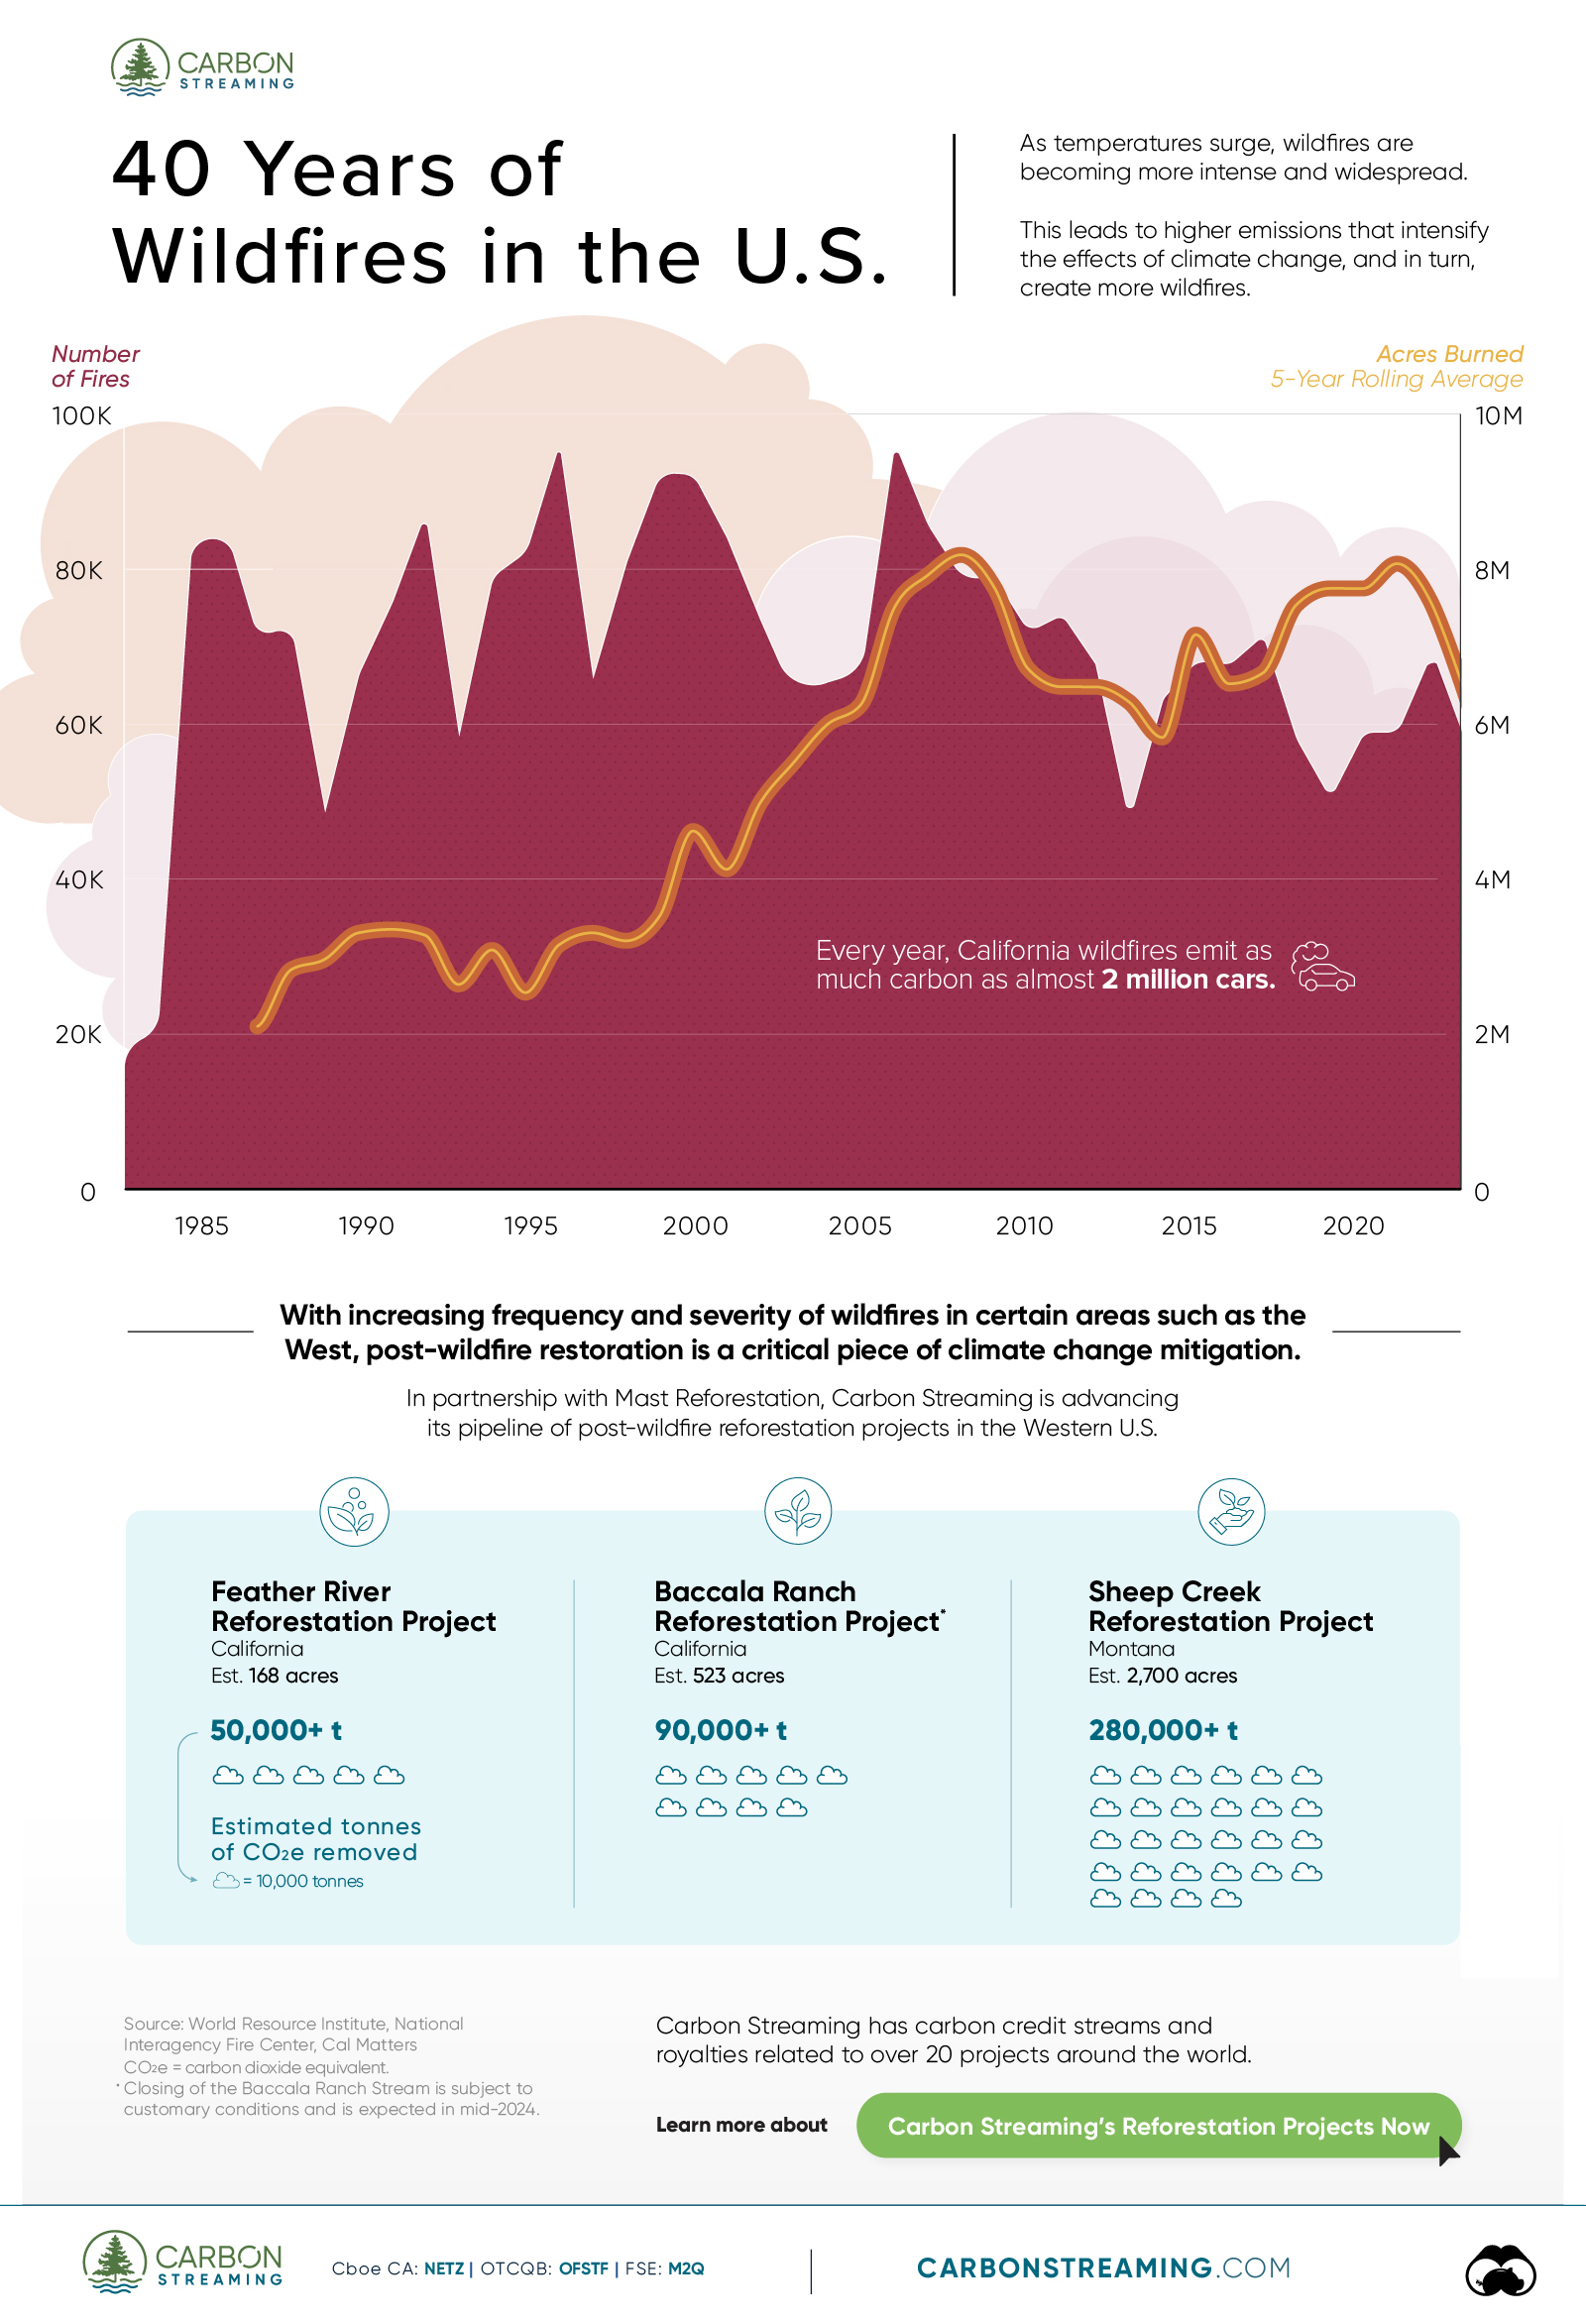
We partnered with Carbon Streaming to illustrate four decades (1983–2023) of wildfire activity in the U.S. Let’s dive in.
The Evolution of Wildfires Over Time
The data we used comes from the National Interagency Fire Center and highlights the number of wildfires that occurred between 1983 and 2023, along with the average acres burned over the same time period. The 5-year rolling average was calculated based on the current year plus the preceding four years.
As the table below shows, the total area burned across the U.S. in 2023 was significantly below average, and the number of wildfires was slightly below average due in part to cooler weather conditions.
| Year | Number of Wildfires | Acres Burned | 5-Year Rolling Average |
|---|---|---|---|
| 2023 | 56,580 | 2,693,910 | 6,436,687 |
| 2022 | 68,988 | 7,577,183 | 7,651,404 |
| 2021 | 58,985 | 7,125,643 | 8,141,184 |
| 2020 | 58,950 | 10,122,336 | 7,818,055 |
| 2019 | 50,477 | 4,664,364 | 7,818,617 |
| 2018 | 58,083 | 8,767,492 | 7,604,867 |
| 2017 | 71,499 | 10,026,086 | 6,715,278 |
| 2016 | 67,743 | 5,509,995 | 6,575,308 |
| 2015 | 68,151 | 10,125,149 | 7,215,583 |
| 2014 | 63,312 | 3,595,613 | 5,875,098 |
| 2013 | 47,579 | 4,319,546 | 6,340,332 |
| 2012 | 67,774 | 9,326,238 | 6,534,917 |
| 2011 | 74,126 | 8,711,367 | 6,535,278 |
| 2010 | 71,971 | 3,422,724 | 6,767,754 |
| 2009 | 78,792 | 5,921,786 | 7,821,087 |
| 2008 | 78,979 | 5,292,468 | 8,256,305 |
| 2007 | 85,705 | 9,328,045 | 7,989,980 |
| 2006 | 96,385 | 9,873,745 | 7,561,314 |
| 2005 | 66,753 | 8,689,389 | 6,300,747 |
| 2004 | 65,461 | 8,097,880* | 6,041,568 |
| 2003 | 63,629 | 3,960,842 | 5,547,210 |
| 2002 | 73,457 | 7,184,712 | 5,020,983 |
| 2001 | 84,079 | 3,570,911 | 4,155,432 |
| 2000 | 92,250 | 7,393,493 | 4,654,449 |
| 1999 | 92,487 | 5,626,093 | 3,543,860 |
| 1998 | 81,043 | 1,329,704 | 3,233,357 |
| 1997 | 66,196 | 2,856,959 | 3,326,931 |
| 1996 | 96,363 | 6,065,998 | 3,169,525 |
| 1995 | 82,234 | 1,840,546 | 2,547,041 |
| 1994 | 79,107 | 4,073,579 | 3,103,256 |
| 1993 | 58,810 | 1,797,574 | 2,654,002 |
| 1992 | 87,394 | 2,069,929 | 3,296,346 |
| 1991 | 75,754 | 2,953,578 | 3,371,819 |
| 1990 | 66,481 | 4,621,621 | 3,324,936 |
| 1989 | 48,949 | 1,827,310 | 2,979,841 |
| 1988 | 72,750 | 5,009,290 | 2,844,061 |
| 1987 | 71,300 | 2,447,296 | 2,106,936 |
| 1986 | 85,907 | 2,719,162 | N/A |
| 1985 | 82,591 | 2,896,147 | N/A |
| 1984 | 20,493 | 1,148,409 | N/A |
| 1983 | 18,229 | 1,323,666 | N/A |
*2004 fires and acres do not include state lands for North Carolina
What’s the impact of the increasing burned areas and severity of wildfires over time?
Simply put, when wildfires burn, they release smoke and gas into the air which makes the Earth warmer, making it easier for more wildfires to start and spread. This cycle is often referred to as the fires and climate feedback loop, and is the reason why experts believe that wildfires will only continue to worsen.
Wildfire Havoc in the West
2023 marked a year of severe wildfire destruction on the West Coast and in Hawaii. The Maui wildfires in August, for example, led to the destruction of 2,308 structures and at time of writing, 5,000 residents are still displaced six months later. Additionally, the cost of rebuilding Maui could exceed $5 billion and take several years.
Post-wildfire restoration is a critical piece of climate change mitigation, particularly in the states that need it the most.
What Can Be Done?
In partnership with Mast Reforestation, Carbon Streaming is advancing its pipeline of post-wildfire reforestation projects in Western U.S. states.
To date, Carbon Streaming has entered into carbon credit streams to provide funding for three reforestation projects—Sheep Creek in Montana and Feather River and Baccala Ranch in California.
Mast Reforestation’s unique approach combines proven reforestation practices with new technology to regrow resilient, climate-adapted forests. Want to know more?
Learn more about Carbon Streaming’s Reforestation Projects

-

 Green19 hours ago
The Carbon Footprint of Major Travel Methods
Going on a cruise ship and flying domestically are the most carbon-intensive travel methods.
-

 Green2 weeks ago
Ranking the Top 15 Countries by Carbon Tax Revenue
This graphic highlights France and Canada as the global leaders when it comes to generating carbon tax revenue.
-

 Green2 weeks ago
Ranked: The Countries With the Most Air Pollution in 2023
South Asian nations are the global hotspot for pollution. In this graphic, we rank the world’s most polluted countries according to IQAir.
-

 Green2 weeks ago
Top Countries By Forest Growth Since 2001
One country is taking reforestation very seriously, registering more than 400,000 square km of forest growth in two decades.
-

 Green3 weeks ago
Ranked: Top Countries by Total Forest Loss Since 2001
The country with the most forest loss since 2001 lost as much forest cover as the next four countries combined.
-

 Agriculture2 months ago
The World’s Top Cocoa Producing Countries
Here are the largest cocoa producing countries globally—from Côte d’Ivoire to Brazil—as cocoa prices hit record highs.
