Maps
The Largest Earthquakes in the New York Area (1970-2024)
![]() See this visualization first on the Voronoi app.
See this visualization first on the Voronoi app.

The Largest Earthquakes in the New York Area
This was originally posted on our Voronoi app. Download the app for free on Apple or Android and discover incredible data-driven charts from a variety of trusted sources.
The 4.8 magnitude earthquake that shook buildings across New York on Friday, April 5th, 2024 was the third-largest quake in the U.S. Northeast area over the past 50 years.
In this map, we illustrate earthquakes with a magnitude of 4.0 or greater recorded in the Northeastern U.S. since 1970, according to the United States Geological Survey (USGS).
Shallow Quakes and Older Buildings
The earthquake that struck the U.S. Northeast in April 2024 was felt by millions of people from Washington, D.C., to north of Boston. It even caused a full ground stop at Newark Airport.
The quake, occurring just 5 km beneath the Earth’s surface, was considered shallow, which is what contributed to more intense shaking at the surface.
According to the USGS, rocks in the eastern U.S. are significantly older, denser, and harder than those on the western side, compressed by time. This makes them more efficient conduits for seismic energy. Additionally, buildings in the Northeast tend to be older and may not adhere to the latest earthquake codes.
Despite disrupting work and school life, the earthquake was considered minor, according to the Michigan Technological University magnitude scale:
| Magnitude | Earthquake Effects | Estimated Number Each Year |
|---|---|---|
| 2.5 or less | Usually not felt, but can be recorded by seismograph. | Millions |
| 2.5 to 5.4 | Often felt, but only causes minor damage. | 500,000 |
| 5.5 to 6.0 | Slight damage to buildings and other structures. | 350 |
| 6.1 to 6.9 | May cause a lot of damage in very populated areas. | 100 |
| 7.0 to 7.9 | Major earthquake. Serious damage. | 10-15 |
| 8.0 or greater | Great earthquake. Can totally destroy communities near the epicenter. | One every year or two |
The largest earthquake felt in the area over the past 50 years was a 5.3 magnitude quake that occurred in Au Sable Forks, New York, in 2002. It damaged houses and cracked roads in a remote corner of the Adirondack Mountains, but caused no injuries.
| Date | Magnitude | Location | State |
|---|---|---|---|
| April 20, 2002 | 5.3 | Au Sable Forks | New York |
| October 7, 1983 | 5.1 | Newcomb | New York |
| April 5, 2024 | 4.8 | Whitehouse Station | New Jersey |
| October 16, 2012 | 4.7 | Hollis Center | Maine |
| January 16, 1994 | 4.6 | Sinking Spring | Pennsylvania |
| January 19, 1982 | 4.5 | Sanbornton | New Hampshire |
| September 25, 1998 | 4.5 | Adamsville | Pennsylvania |
| June 9, 1975 | 4.2 | Altona | New York |
| May 29, 1983 | 4.2 | Peru | Maine |
| April 23, 1984 | 4.2 | Conestoga | Pennsylvania |
| January 16, 1994 | 4.2 | Sinking Spring | Pennsylvania |
| November 3, 1975 | 4 | Long Lake | New York |
| June 17, 1991 | 4 | Worcester | New York |
The largest earthquake in U.S. history, however, was the 1964 Good Friday quake in Alaska, measuring 9.2 magnitude and killing 131 people.


Maps
Mapped: The U.S. State that Each Country Trades With the Most
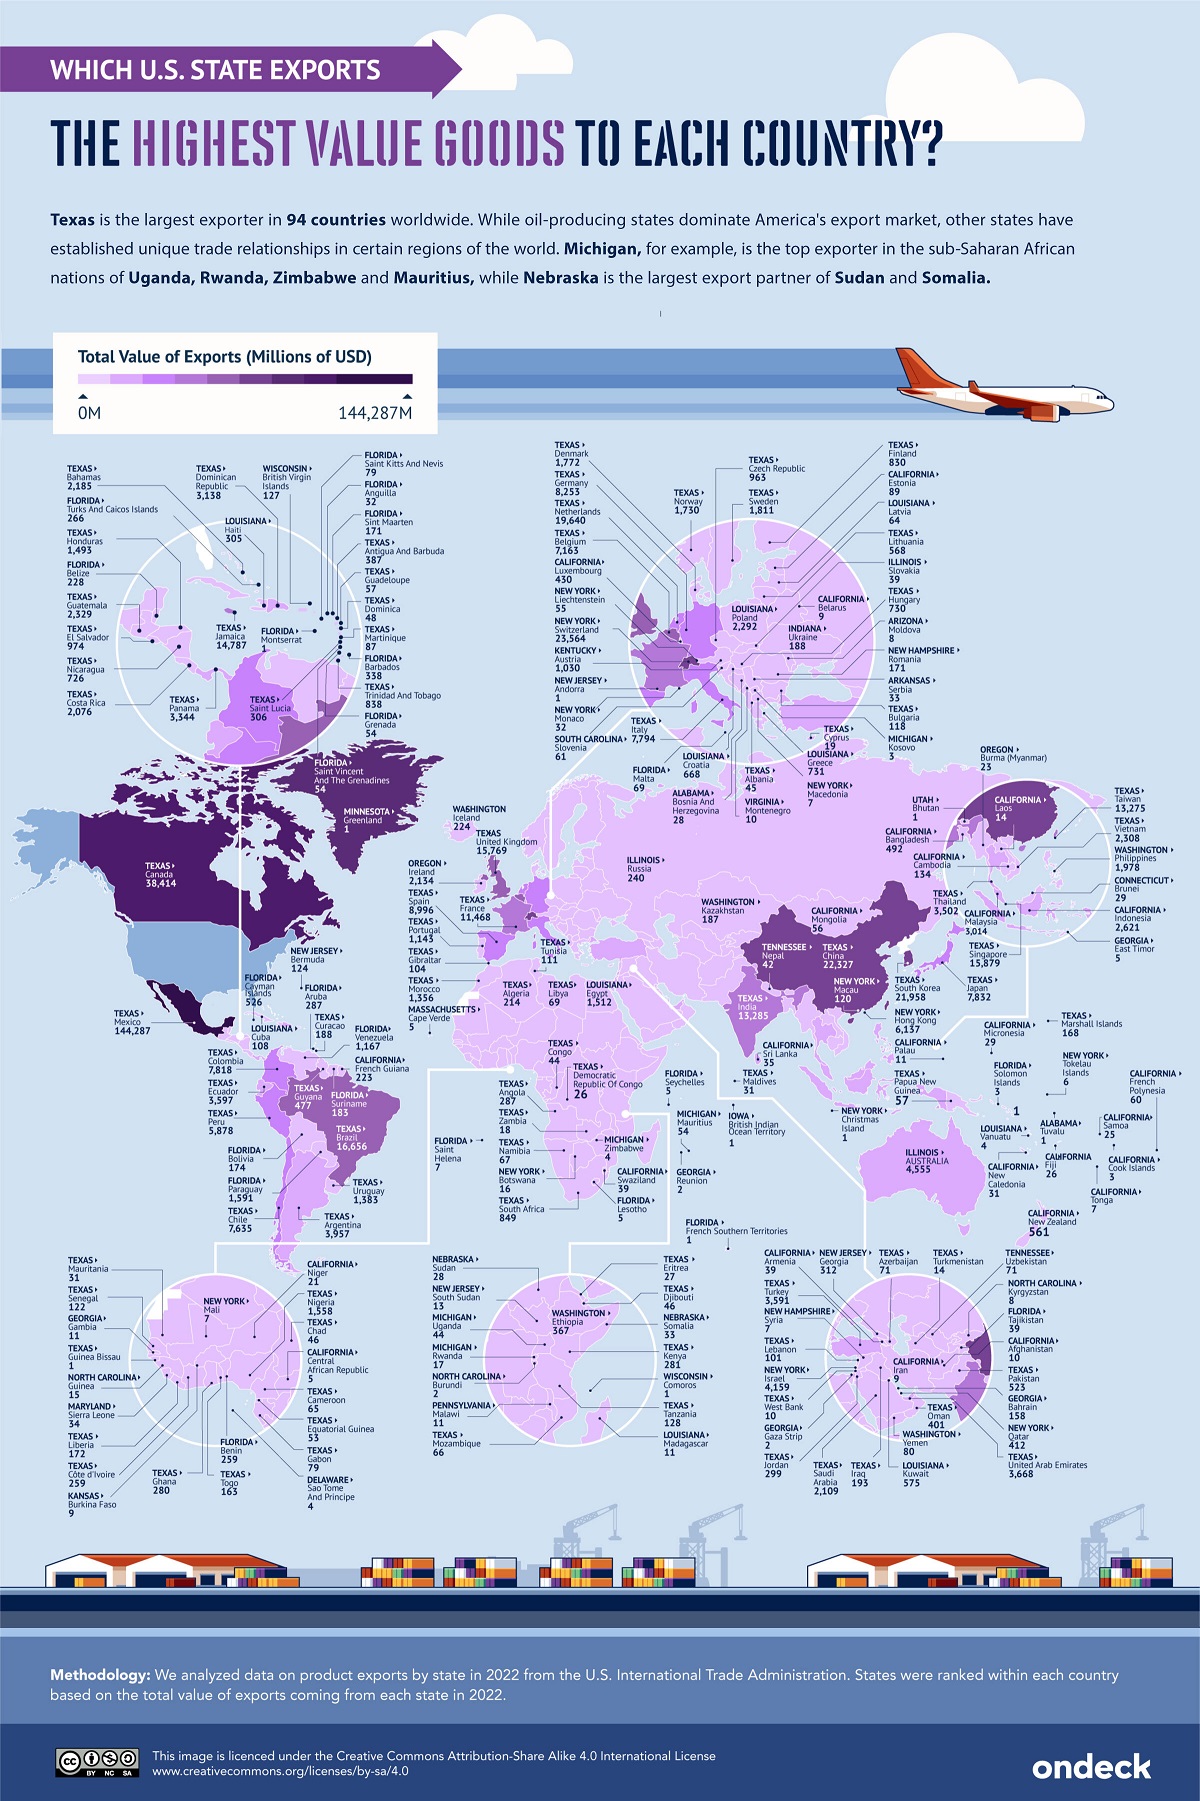
This map identifies the biggest U.S. export markets by state, showing the top partner of each country by value of goods imported.
 Creator Program
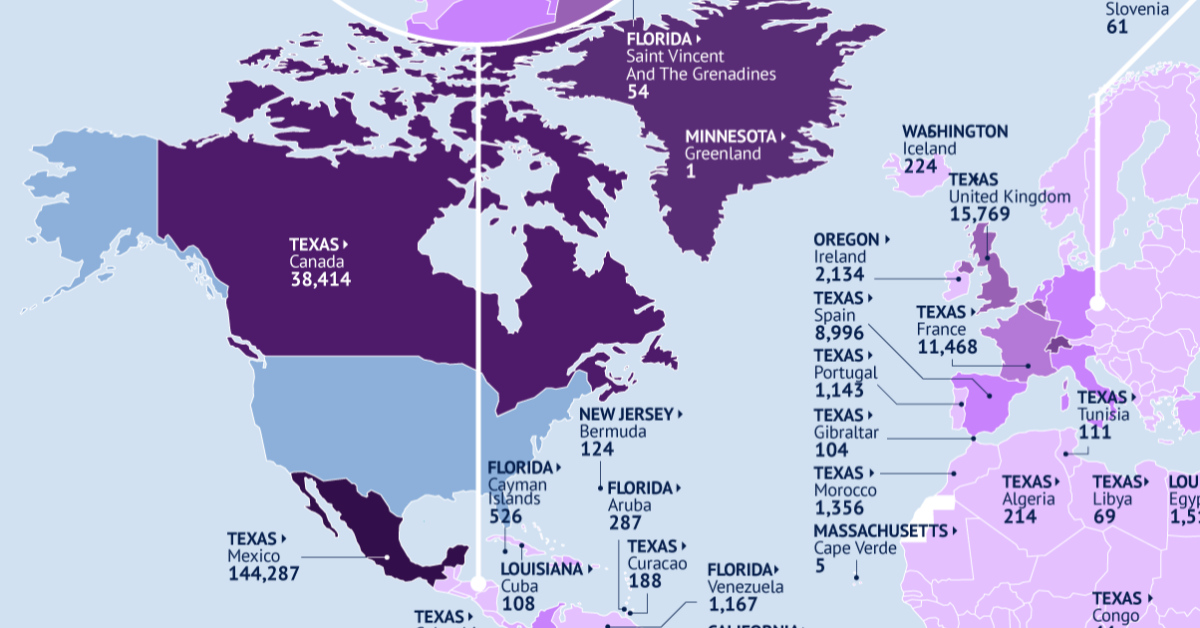
The U.S. State that Each Country Trades With the Most
The U.S. is the world’s second-largest exporter, just behind China. In 2022 alone, America exported some $2.1 trillion, accounting for 8.4% of global exports.
In this graphic by OnDeck, we show the U.S. state that each country receives the most exports from, using data from the U.S. International Trade Administration.
Texas is the Top Exporter
Texas is the leading U.S. exporter to major global economies. The state leads in 94 countries, including Canada, China, the U.K., and Germany. Texas is followed by California (25 countries) and Florida (24 countries).
| State | 2023 Exports (Millions) |
|---|---|
| Texas | $444,608 |
| California | $178,717 |
| Louisiana | $100,197 |
| New York | $97,828 |
| Illinois | $78,724 |
| Unallocated | $73,829 |
| Florida | $68,899 |
| Michigan | $64,904 |
| Washington | $61,209 |
| Indiana | $56,081 |
| Ohio | $55,764 |
| Pennsylvania | $52,876 |
| Georgia | $49,772 |
| New Jersey | $43,334 |
| North Carolina | $42,223 |
| Kentucky | $40,212 |
| Tennessee | $38,120 |
| South Carolina | $37,297 |
| Massachusetts | $35,221 |
| Arizona | $28,791 |
| Wisconsin | $28,021 |
| Oregon | $27,718 |
| Alabama | $27,447 |
| Minnesota | $24,920 |
| Puerto Rico | $22,493 |
| Virginia | $22,395 |
| Iowa | $18,439 |
| Maryland | $18,360 |
| Missouri | $17,858 |
| Utah | $17,388 |
| Connecticut | $15,825 |
| Mississippi | $14,305 |
| Kansas | $14,148 |
| Colorado | $10,378 |
| Nevada | $9,533 |
| Nebraska | $7,987 |
| New Hampshire | $7,638 |
| North Dakota | $7,520 |
| Oklahoma | $6,511 |
| Arkansas | $6,450 |
| West Virginia | $5,652 |
| Alaska | $5,244 |
| New Mexico | $4,940 |
| Delaware | $4,921 |
| Idaho | $4,011 |
| Virgin Islands | $3,403 |
| Rhode Island | $3,016 |
| Maine | $2,951 |
| South Dakota | $2,399 |
| Montana | $2,231 |
| Wyoming | $2,143 |
| Vermont | $1,991 |
| District of Columbia | $1,746 |
| Hawaii | $570 |
Exports from Texas to Mexico have an annual value of $144.29 billion—the highest value of exports from a U.S. state to any country. From this total, Texas exports $33.63 billion in Petroleum & Coal Products to Mexico yearly, the highest value of any single product category from a state to another country.
While oil-producing states like Texas, New Mexico, and North Dakota dominate America’s export market, other states have established unique trade relationships in some regions.
Michigan, for example, exports $15.37 billion in Transportation Equipment to Canada. These include passenger vehicles and trucks, as well as parts.
Australia imports $4.56 billion in goods from Illinois each year, more than from any other U.S. state.
New York State’s exports to Switzerland reached $23.56 billion in 2022. Over three-quarters of this trade is in the category of Primary Metal Manufactures, which includes upstream metal products such as closures, castings, pipes, tubes, wires, and springs.
Hong Kong also counts New York as the state from which it imports the most.

-

 Debt1 week ago
How Debt-to-GDP Ratios Have Changed Since 2000
-

 Markets3 weeks ago
Ranked: The World’s Top Flight Routes, by Revenue
-

 Countries2 weeks ago
Population Projections: The World’s 6 Largest Countries in 2075
-

 Markets2 weeks ago
The Top 10 States by Real GDP Growth in 2023
-

 Demographics2 weeks ago
The Smallest Gender Wage Gaps in OECD Countries
-

 United States2 weeks ago
Where U.S. Inflation Hit the Hardest in March 2024
-

 Green2 weeks ago
Top Countries By Forest Growth Since 2001
-

 United States2 weeks ago
Ranked: The Largest U.S. Corporations by Number of Employees