Markets
Mapped: The Top Global Financial Centers in 2023
Subscribe to the Advisor Channel free mailing list for more like this
The Top Global Financial Centers in 2023
This was originally posted on Advisor Channel. Sign up to the free mailing list to get beautiful visualizations on financial markets that help advisors and their clients.
For centuries, global financial centers have served as a linchpin for capital market activity.
These hubs share important features, from the infrastructure to facilitate billions of transactions to the regulatory framework to promote more transparent markets. As economies have evolved, so have centers for global business—however the transition can shift slowly.
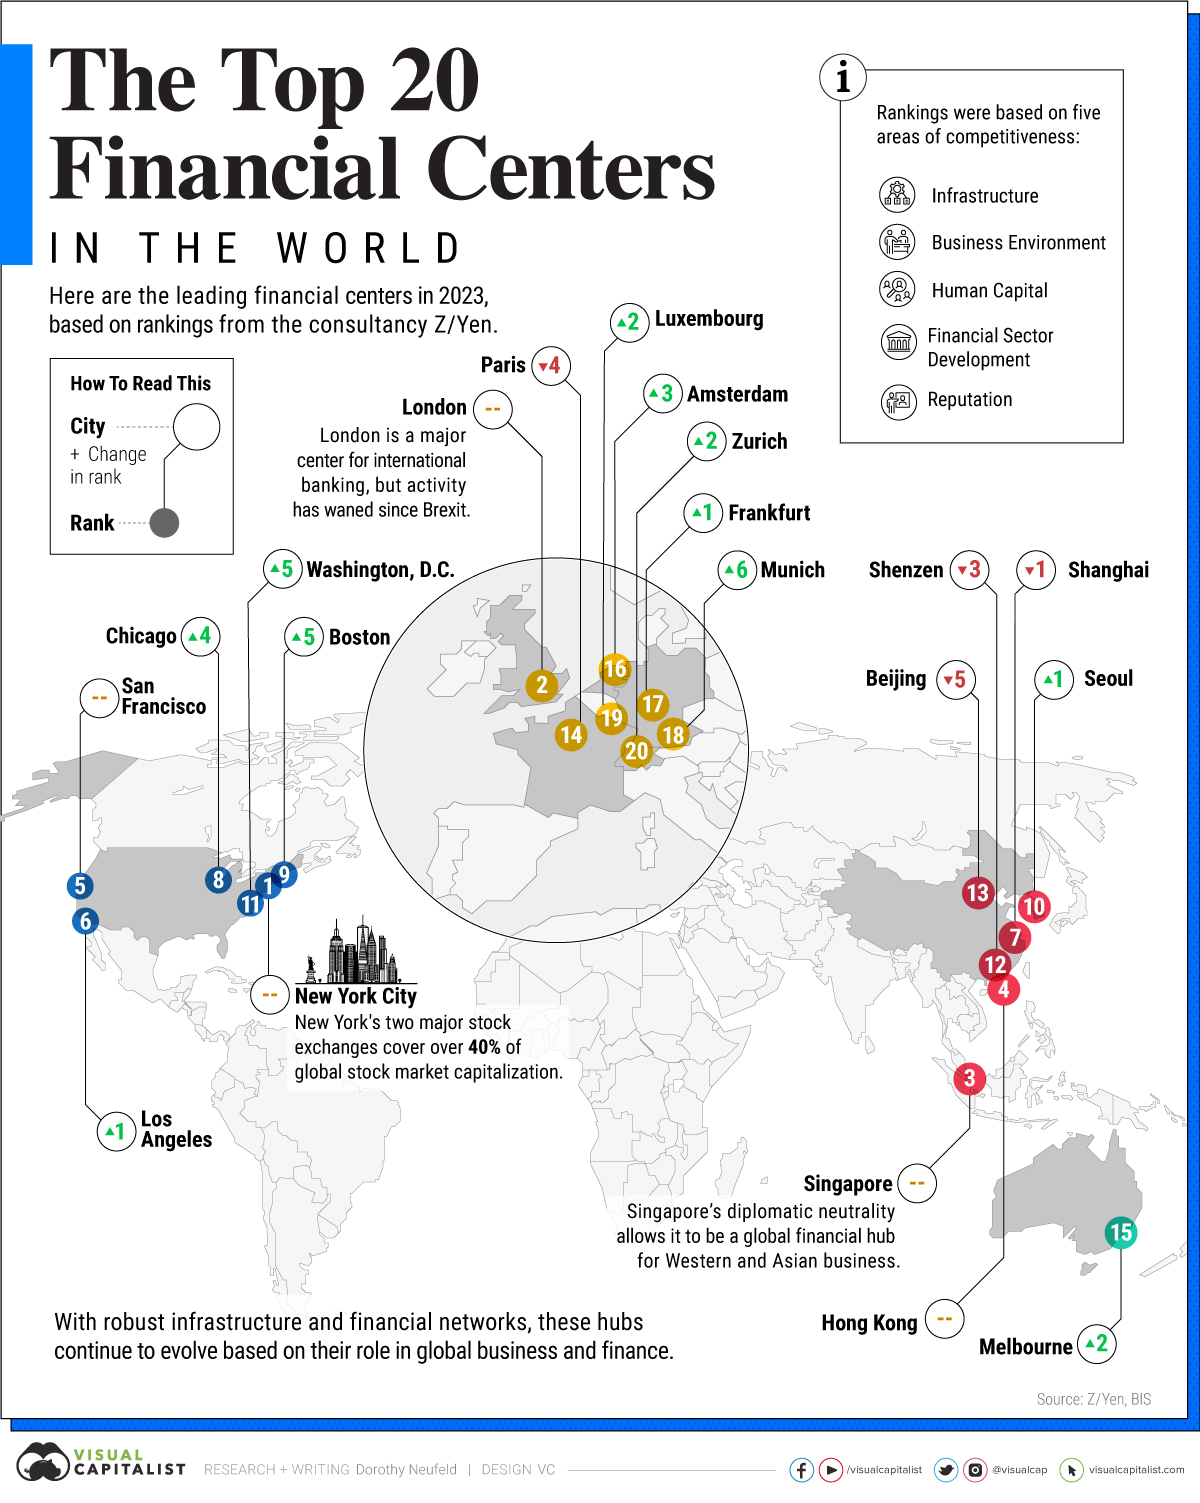
This graphic shows the top global financial centers in 2023, based on rankings from the consultancy group Z/Yen.
How Cities Were Ranked
To analyze the strength of each financial center, Z/Yen looked at the following areas of competitiveness:
- Financial Sector Development
- Business Environment
- Human Capital
- Infrastructure
- Reputation
Each of these categories has four subcomponents, which altogether arrive at a cities score.
The World’s Leading Financial Centers
In 2023, New York remained the epicenter for global finance.
With $46 trillion in stock market capitalization, it captures 40% of the world’s total, thanks to the depth and liquidity of its markets. Domestic and international companies look to list on its exchanges due to their broad investor base.
Roughly 330,000 people work in financial services, however, financial firms are increasingly moving out of the city. Since the end of 2019, $993 billion in assets across 158 companies have moved headquarters driven by lower taxes in other states.
| Ranking | Financial Center | Country | Change in Rank 2022-2023 |
|---|---|---|---|
| 1 | New York | 🇺🇸 U.S. | +0 |
| 2 | London | 🇬🇧 UK | +0 |
| 3 | Singapore | 🇸🇬 Singapore | +0 |
| 4 | Hong Kong SAR | 🇭🇰 Hong Kong SAR | +0 |
| 5 | San Francisco | 🇺🇸 U.S. | +0 |
| 6 | Los Angeles | 🇺🇸 U.S. | +1 |
| 7 | Shanghai | 🇨🇳 China | -1 |
| 8 | Chicago | 🇺🇸 U.S. | +4 |
| 9 | Boston | 🇺🇸 U.S. | +5 |
| 10 | Seoul | 🇰🇷 South Korea | +1 |
| 11 | Washington DC | 🇺🇸 U.S. | +4 |
| 12 | Shenzhen | 🇨🇳 China | -3 |
| 13 | Beijing | 🇨🇳 China | -5 |
| 14 | Paris | 🇫🇷 France | -4 |
| 15 | Sydney | 🇦🇺 Australia | -2 |
| 16 | Amsterdam | 🇳🇱 Netherlands | +3 |
| 17 | Frankfurt | 🇩🇪 Germany | +1 |
| 18 | Munich | 🇩🇪 Germany | +6 |
| 19 | Luxembourg | 🇱🇺 Luxembourg | +2 |
| 20 | Zurich | 🇨🇭 Switzerland | +2 |
London ranked second given its role as an investment banking and foreign-exchange trading hub. While it remains a dominant center, international banking has waned since Brexit as business has shifted to the euro area.
With a population of six million people, Singapore fell in third. Its diplomatic neutrality allows Asian and Western companies to conduct business in the country, operating as the “Switzerland of Asia”. Tech giants from Google to Alibaba have their regional headquarters based in the commerce hub.
This year, Hong Kong ranked fourth, followed by San Francisco and Los Angeles.
Shanghai (7th) is home to the largest stock exchange in Asia, at $6.6 trillion. However, it fell in rank over the last year along with other major Chinese financial centers.
The Future of Global Financial Centers
Along with ranking the global centers of commerce, Z/Yen highlighted the top centers likely to grow in significance over the next two to three years.
Seoul featured at the top of this list, followed by Singapore and Kigali, Rwanda’s capital.
To attract foreign investors and expand its role as a financial center, Seoul has proposed new tax revisions that exempt income and corporate taxes for foreign companies for three years. While these are still in discussion, obstacles remain.
Overall, the majority of up-and-coming hubs were located in Asia, likely driven by the region’s increasing economic influence over the last several decades.


Markets
The European Stock Market: Attractive Valuations Offer Opportunities
On average, the European stock market has valuations that are nearly 50% lower than U.S. valuations. But how can you access the market?


European Stock Market: Attractive Valuations Offer Opportunities
Europe is known for some established brands, from L’Oréal to Louis Vuitton. However, the European stock market offers additional opportunities that may be lesser known.
The above infographic, sponsored by STOXX, outlines why investors may want to consider European stocks.
Attractive Valuations
Compared to most North American and Asian markets, European stocks offer lower or comparable valuations.
| Index | Price-to-Earnings Ratio | Price-to-Book Ratio |
|---|---|---|
| EURO STOXX 50 | 14.9 | 2.2 |
| STOXX Europe 600 | 14.4 | 2 |
| U.S. | 25.9 | 4.7 |
| Canada | 16.1 | 1.8 |
| Japan | 15.4 | 1.6 |
| Asia Pacific ex. China | 17.1 | 1.8 |
Data as of February 29, 2024. See graphic for full index names. Ratios based on trailing 12 month financials. The price to earnings ratio excludes companies with negative earnings.
On average, European valuations are nearly 50% lower than U.S. valuations, potentially offering an affordable entry point for investors.
Research also shows that lower price ratios have historically led to higher long-term returns.
Market Movements Not Closely Connected
Over the last decade, the European stock market had low-to-moderate correlation with North American and Asian equities.
The below chart shows correlations from February 2014 to February 2024. A value closer to zero indicates low correlation, while a value of one would indicate that two regions are moving in perfect unison.
| EURO STOXX 50 | STOXX EUROPE 600 | U.S. | Canada | Japan | Asia Pacific ex. China |
|
|---|---|---|---|---|---|---|
| EURO STOXX 50 | 1.00 | 0.97 | 0.55 | 0.67 | 0.24 | 0.43 |
| STOXX EUROPE 600 | 1.00 | 0.56 | 0.71 | 0.28 | 0.48 | |
| U.S. | 1.00 | 0.73 | 0.12 | 0.25 | ||
| Canada | 1.00 | 0.22 | 0.40 | |||
| Japan | 1.00 | 0.88 | ||||
| Asia Pacific ex. China | 1.00 |
Data is based on daily USD returns.
European equities had relatively independent market movements from North American and Asian markets. One contributing factor could be the differing sector weights in each market. For instance, technology makes up a quarter of the U.S. market, but health care and industrials dominate the broader European market.
Ultimately, European equities can enhance portfolio diversification and have the potential to mitigate risk for investors.
Tracking the Market
For investors interested in European equities, STOXX offers a variety of flagship indices:
| Index | Description | Market Cap |
|---|---|---|
| STOXX Europe 600 | Pan-regional, broad market | €10.5T |
| STOXX Developed Europe | Pan-regional, broad-market | €9.9T |
| STOXX Europe 600 ESG-X | Pan-regional, broad market, sustainability focus | €9.7T |
| STOXX Europe 50 | Pan-regional, blue-chip | €5.1T |
| EURO STOXX 50 | Eurozone, blue-chip | €3.5T |
Data is as of February 29, 2024. Market cap is free float, which represents the shares that are readily available for public trading on stock exchanges.
The EURO STOXX 50 tracks the Eurozone’s biggest and most traded companies. It also underlies one of the world’s largest ranges of ETFs and mutual funds. As of November 2023, there were €27.3 billion in ETFs and €23.5B in mutual fund assets under management tracking the index.
“For the past 25 years, the EURO STOXX 50 has served as an accurate, reliable and tradable representation of the Eurozone equity market.”
— Axel Lomholt, General Manager at STOXX
Partnering with STOXX to Track the European Stock Market
Are you interested in European equities? STOXX can be a valuable partner:
- Comprehensive, liquid and investable ecosystem
- European heritage, global reach
- Highly sophisticated customization capabilities
- Open architecture approach to using data
- Close partnerships with clients
- Part of ISS STOXX and Deutsche Börse Group
With a full suite of indices, STOXX can help you benchmark against the European stock market.
Learn how STOXX’s European indices offer liquid and effective market access.

-

 Economy2 days ago
Economic Growth Forecasts for G7 and BRICS Countries in 2024
The IMF has released its economic growth forecasts for 2024. How do the G7 and BRICS countries compare?
-

 Markets1 week ago
U.S. Debt Interest Payments Reach $1 Trillion
U.S. debt interest payments have surged past the $1 trillion dollar mark, amid high interest rates and an ever-expanding debt burden.
-

 United States2 weeks ago
Ranked: The Largest U.S. Corporations by Number of Employees
We visualized the top U.S. companies by employees, revealing the massive scale of retailers like Walmart, Target, and Home Depot.
-

 Markets2 weeks ago
The Top 10 States by Real GDP Growth in 2023
This graphic shows the states with the highest real GDP growth rate in 2023, largely propelled by the oil and gas boom.
-

 Markets2 weeks ago
Ranked: The World’s Top Flight Routes, by Revenue
In this graphic, we show the highest earning flight routes globally as air travel continued to rebound in 2023.
-

 Real Estate2 weeks ago
Ranked: The Most Valuable Housing Markets in America
The U.S. residential real estate market is worth a staggering $47.5 trillion. Here are the most valuable housing markets in the country.


-

 Education1 week ago
How Hard Is It to Get Into an Ivy League School?
-

 Technology2 weeks ago
Ranked: Semiconductor Companies by Industry Revenue Share
-
Markets2 weeks ago
Ranked: The World’s Top Flight Routes, by Revenue
-

 Demographics2 weeks ago
Population Projections: The World’s 6 Largest Countries in 2075
-
Markets2 weeks ago
The Top 10 States by Real GDP Growth in 2023
-

 Demographics2 weeks ago
The Smallest Gender Wage Gaps in OECD Countries
-

 Economy2 weeks ago
Where U.S. Inflation Hit the Hardest in March 2024
-

 Environment2 weeks ago
Top Countries By Forest Growth Since 2001