Markets
The Investment Playbook for 2024: Visualized
This visual is part of our 2024 Global Forecast Series. For full access to the series, learn more here.

How Are Top Investment Banks Investing in 2024?
As investors look ahead to next year’s global economic environment of higher interest rates and heightened geopolitical fragmentation, growth concerns and unexpected volatility present new challenges.
With many top banks advising on putting capital to work while urging caution and active management of portfolios for 2024, which investment strategies and assets are they looking at for the upcoming year?
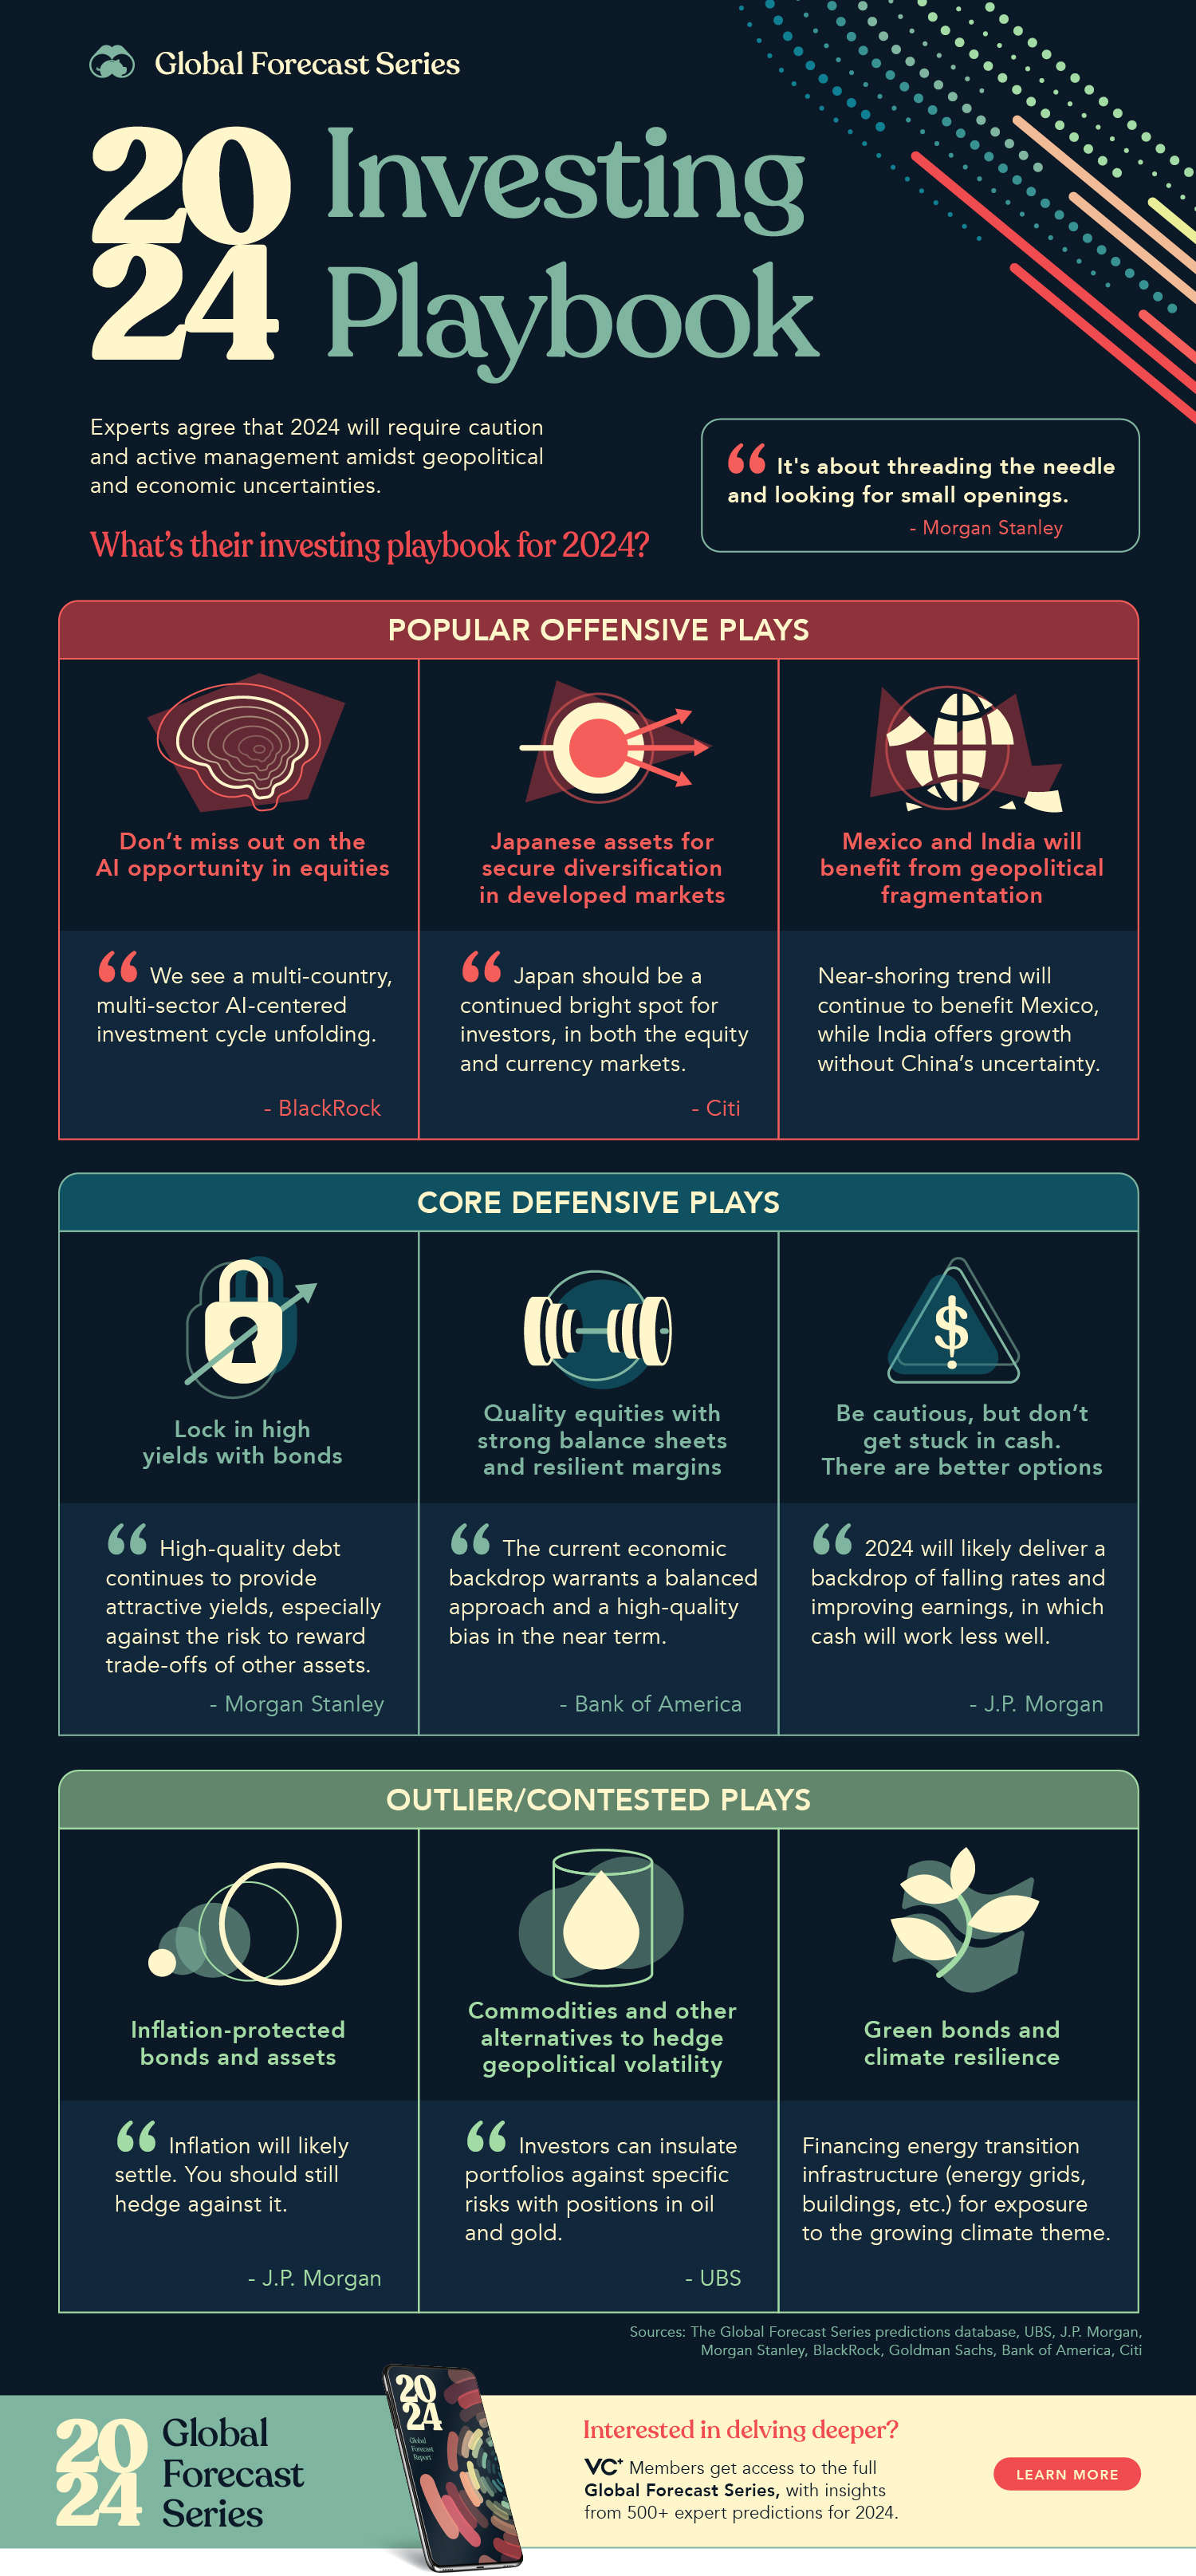
This graphic compiles insights from the 2024 investment outlooks of various major institutions like Goldman Sachs, J.P. Morgan, UBS, and more into a single investing playbook for next year. From their core defensive holdings to the more aggressive investing themes they’re eyeing, here’s what many of the top banking institutions agree on for next year.

Deploy Capital But Stick to Quality Bonds and Stocks
Investing capital in 2024 presents its challenges and risks, however, many top investment banks are in consensus that the new macroeconomic environment of higher interest rates and unsettled inflation (which could surge again) renders holding cash equally risky.
Many outlooks suggest going back to basics for deploying cash into core holdings: high quality bonds to lock in elevated yields and recession-resilient equities with strong balance sheets.
“In our view, government bond markets are overpricing the risk that high interest rates will represent the new normal, and we also expect yields to fall in 2024. This speaks in favor of limiting cash allocations and locking in yields in quality bonds.”
– UBS
With interest rates likely at their peak as cuts forecasted by many (including the Federal Reserve) for 2024, real and nominal bond yields offer security with attractive income prospects.
Institutions like BlackRock and Bank of America highlight the opportunity found in inflation-linked bonds like Treasury Inflation-Protected Securities (TIPS), which offer decent income at around 2% across various durations while also insulating against the potential for sticky or surging inflation.
“Earning a positive, substantial yield after inflation on U.S. government-guaranteed securities is a welcome relief for savers after years of financial repression.”
– Bank of America
When it comes to equities, many institutions are favoring large-caps with strong balance sheets that can withstand a possible contraction in earnings should a recession materialize.
“We think that in a “higher rates for longer” world, strong balance sheet companies and larger companies probably still have scope to extend their outperformance on average.”
– Goldman Sachs
Artificial Intelligence Offers Outsized Opportunity
If there’s one common investment theme many institutions are willing to be aggressive on, it’s the outsized potential opportunity artificial intelligence offers the market.
From the mega-cap AI leaders which defined the past year like Microsoft, Meta, and Alphabet to the underlying hardware and data center providers, the continuous progression of artificial intelligence and its infrastructure offers various investment avenues.
“The most obvious beneficiaries of the generative AI revolution have already seen an expanded growth in their market cap in 2023, but there are potential opportunities as we enter the next stages of buildout.”
– Citi
The variety in the supporting layers of AI’s tech stack like cloud and data infrastructure has many favoring the tech sector overall in 2024.
Investors willing to take more risk in search of specific industry exposure can look at niches with the highest potential to reap AI’s productivity benefits and downstream effects like fintech, robotics, and cybersecurity.
“We see the tech sector’s earnings resilience persisting and expect it to be major driver of overall U.S. corporate profit growth in 2024.”
– BlackRock
Global Diversification Amidst Geopolitical Fragmentation
While the now familiar fractured and increasingly bipolar geopolitical landscape poses plenty of risks next year, many institutions are also identifying the beneficiaries of this changing world order.
“Global diversification may add value to the portfolios as economies diverge and move at their own pace.”
– Goldman Sachs
India and Mexico are top picks across many of the outlooks, as both emerging nations have strong long-term supporting catalysts. India’s strong demographics and diversity in sectors offers large growth prospects as Western supply chains and trade potentially continue to shift away from China.
Mexico, on the other hand, looks poised to further benefit from the ongoing trend of U.S. companies near-shoring manufacturing and operations, with the peso having risen 13% YTD in 2023 against the U.S. dollar due to an influx of foreign capital.
“India and Mexico are likely to benefit from a longer-term reorientation of global supply chains and consequent expansion of their domestic manufacturing capacity.”– Bank of America
Lastly, both Japan‘s currency and its equities are a common pick for developed market diversification, with various institutions noting its appealing valuations and earnings growth bolstered by fiscal and monetary policy.
“Japanese policymakers have been an outlier among central banks, keeping interest rates low to boost growth.”
– Morgan Stanley


Markets
The European Stock Market: Attractive Valuations Offer Opportunities
On average, the European stock market has valuations that are nearly 50% lower than U.S. valuations. But how can you access the market?


European Stock Market: Attractive Valuations Offer Opportunities
Europe is known for some established brands, from L’Oréal to Louis Vuitton. However, the European stock market offers additional opportunities that may be lesser known.
The above infographic, sponsored by STOXX, outlines why investors may want to consider European stocks.
Attractive Valuations
Compared to most North American and Asian markets, European stocks offer lower or comparable valuations.
| Index | Price-to-Earnings Ratio | Price-to-Book Ratio |
|---|---|---|
| EURO STOXX 50 | 14.9 | 2.2 |
| STOXX Europe 600 | 14.4 | 2 |
| U.S. | 25.9 | 4.7 |
| Canada | 16.1 | 1.8 |
| Japan | 15.4 | 1.6 |
| Asia Pacific ex. China | 17.1 | 1.8 |
Data as of February 29, 2024. See graphic for full index names. Ratios based on trailing 12 month financials. The price to earnings ratio excludes companies with negative earnings.
On average, European valuations are nearly 50% lower than U.S. valuations, potentially offering an affordable entry point for investors.
Research also shows that lower price ratios have historically led to higher long-term returns.
Market Movements Not Closely Connected
Over the last decade, the European stock market had low-to-moderate correlation with North American and Asian equities.
The below chart shows correlations from February 2014 to February 2024. A value closer to zero indicates low correlation, while a value of one would indicate that two regions are moving in perfect unison.
| EURO STOXX 50 | STOXX EUROPE 600 | U.S. | Canada | Japan | Asia Pacific ex. China |
|
|---|---|---|---|---|---|---|
| EURO STOXX 50 | 1.00 | 0.97 | 0.55 | 0.67 | 0.24 | 0.43 |
| STOXX EUROPE 600 | 1.00 | 0.56 | 0.71 | 0.28 | 0.48 | |
| U.S. | 1.00 | 0.73 | 0.12 | 0.25 | ||
| Canada | 1.00 | 0.22 | 0.40 | |||
| Japan | 1.00 | 0.88 | ||||
| Asia Pacific ex. China | 1.00 |
Data is based on daily USD returns.
European equities had relatively independent market movements from North American and Asian markets. One contributing factor could be the differing sector weights in each market. For instance, technology makes up a quarter of the U.S. market, but health care and industrials dominate the broader European market.
Ultimately, European equities can enhance portfolio diversification and have the potential to mitigate risk for investors.
Tracking the Market
For investors interested in European equities, STOXX offers a variety of flagship indices:
| Index | Description | Market Cap |
|---|---|---|
| STOXX Europe 600 | Pan-regional, broad market | €10.5T |
| STOXX Developed Europe | Pan-regional, broad-market | €9.9T |
| STOXX Europe 600 ESG-X | Pan-regional, broad market, sustainability focus | €9.7T |
| STOXX Europe 50 | Pan-regional, blue-chip | €5.1T |
| EURO STOXX 50 | Eurozone, blue-chip | €3.5T |
Data is as of February 29, 2024. Market cap is free float, which represents the shares that are readily available for public trading on stock exchanges.
The EURO STOXX 50 tracks the Eurozone’s biggest and most traded companies. It also underlies one of the world’s largest ranges of ETFs and mutual funds. As of November 2023, there were €27.3 billion in ETFs and €23.5B in mutual fund assets under management tracking the index.
“For the past 25 years, the EURO STOXX 50 has served as an accurate, reliable and tradable representation of the Eurozone equity market.”
— Axel Lomholt, General Manager at STOXX
Partnering with STOXX to Track the European Stock Market
Are you interested in European equities? STOXX can be a valuable partner:
- Comprehensive, liquid and investable ecosystem
- European heritage, global reach
- Highly sophisticated customization capabilities
- Open architecture approach to using data
- Close partnerships with clients
- Part of ISS STOXX and Deutsche Börse Group
With a full suite of indices, STOXX can help you benchmark against the European stock market.
Learn how STOXX’s European indices offer liquid and effective market access.

-

 Economy3 days ago
Economic Growth Forecasts for G7 and BRICS Countries in 2024
The IMF has released its economic growth forecasts for 2024. How do the G7 and BRICS countries compare?
-

 Markets2 weeks ago
U.S. Debt Interest Payments Reach $1 Trillion
U.S. debt interest payments have surged past the $1 trillion dollar mark, amid high interest rates and an ever-expanding debt burden.
-

 United States2 weeks ago
Ranked: The Largest U.S. Corporations by Number of Employees
We visualized the top U.S. companies by employees, revealing the massive scale of retailers like Walmart, Target, and Home Depot.
-

 Markets2 weeks ago
The Top 10 States by Real GDP Growth in 2023
This graphic shows the states with the highest real GDP growth rate in 2023, largely propelled by the oil and gas boom.
-

 Markets3 weeks ago
Ranked: The World’s Top Flight Routes, by Revenue
In this graphic, we show the highest earning flight routes globally as air travel continued to rebound in 2023.
-

 Markets3 weeks ago
Ranked: The Most Valuable Housing Markets in America
The U.S. residential real estate market is worth a staggering $47.5 trillion. Here are the most valuable housing markets in the country.


-

 Science1 week ago
Visualizing the Average Lifespans of Mammals
-
Markets2 weeks ago
The Top 10 States by Real GDP Growth in 2023
-

 Demographics2 weeks ago
The Smallest Gender Wage Gaps in OECD Countries
-

 United States2 weeks ago
Where U.S. Inflation Hit the Hardest in March 2024
-

 Green2 weeks ago
Top Countries By Forest Growth Since 2001
-
United States2 weeks ago
Ranked: The Largest U.S. Corporations by Number of Employees
-

 Maps2 weeks ago
The Largest Earthquakes in the New York Area (1970-2024)
-

 Green2 weeks ago
Ranked: The Countries With the Most Air Pollution in 2023