
In this graphic, we show asset class returns across U.S. equities, bonds, real estate, gold and cash since 1970.


Between equities, real estate, commodities, bonds, and emerging markets, we track which major asset class ended the year on a positive note.
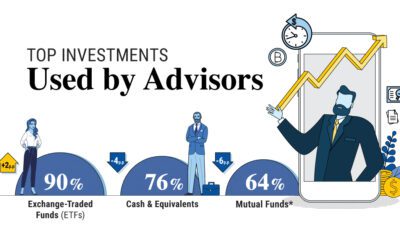

From ETFs to private equity funds, we show the top investments that financial advisors used with their clients over 2023.
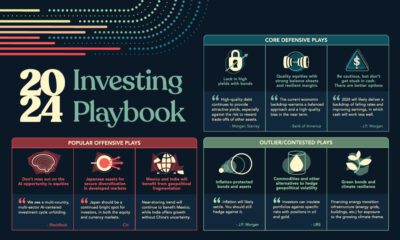

As top institutions advise for cautious deployment of capital next year, what assets and strategies are in their investing playbook in 2024?
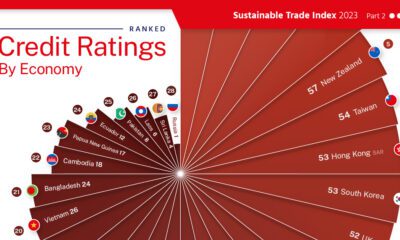

This graphic visualizes 30 country's credit ratings, using data from the 2023 Sustainable Trade Index.
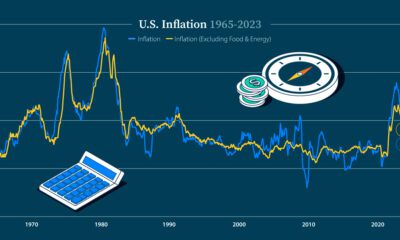

Will the Federal Reserve achieve a soft landing? Here are key factors that play an important role in the direction of the U.S. economy.


This infographic visualizes 10-year annualized forecasts for both equities and fixed income using data from Vanguard.
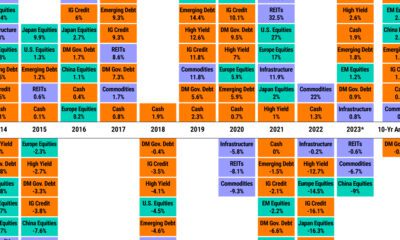

Asset classes vary widely by returns so far in 2023. Which ones are the best-performing, and is a bull market on the horizon?
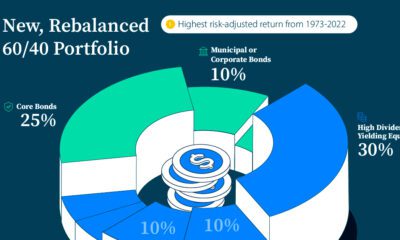

Amid uncertain economic times, a new allocation for the 60/40 portfolio may help investors target higher risk-adjusted returns.
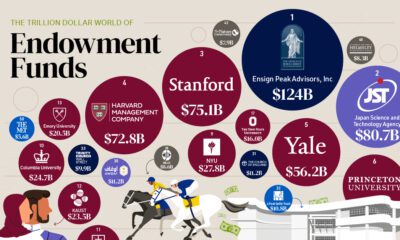

Endowment funds represent the investment arms of nonprofits. See the worlds top 50, which collectively have over $1 trillion in assets.


