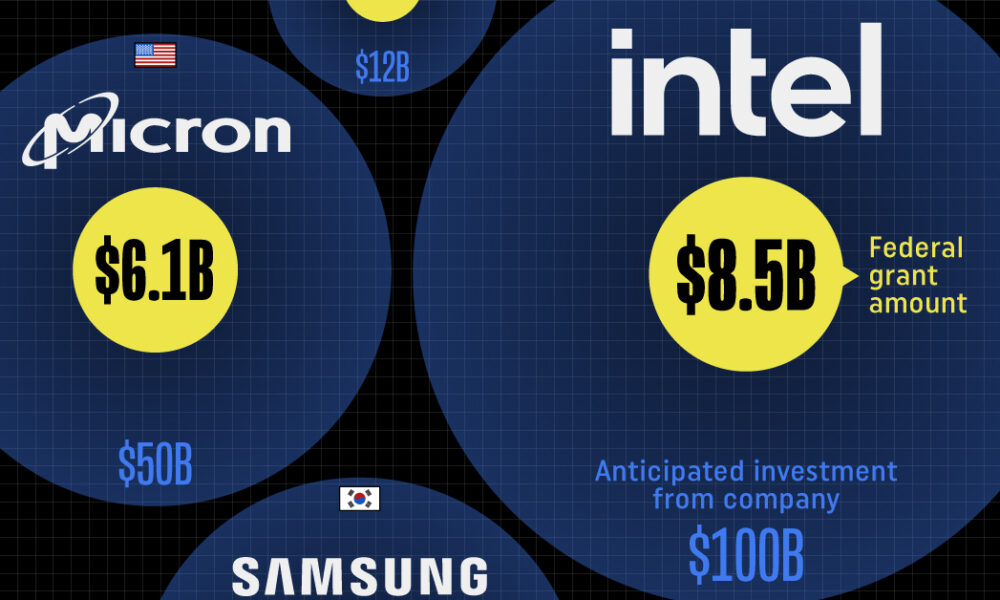
Intel, TSMC, and more have received billions in subsidies from the U.S. CHIPS Act in 2024.


See which countries have been granted the most AI patents each year, from 2012 to 2022.


From complete overhauls to more subtle tweaks, these tech logos have had quite a journey. Featuring: Google, Apple, and more.


Nvidia is coming for Intel’s crown. Samsung is losing ground. AI is transforming the space. We break down revenue for semiconductor companies.


The Nvidia rocket ship is refusing to slow down, leading the pack of strong stock performance for most major U.S. chipmakers.


The expert consensus is that a human-like machine intelligence could emerge by 2059, but what if we could do it in less than half the time?


This graphic breaks down America's most preferred smartphone brands, according to a December 2023 consumer survey.
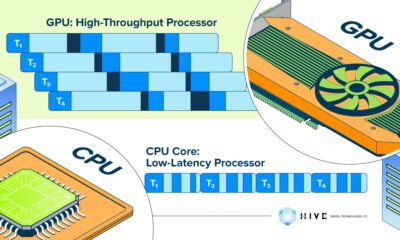

Here's how GPUs differ from traditional CPUs and what gives them an edge in many high-performance computing applications.


This graphic shows how Nvidia's revenue sources have changed over time, highlighting how the AI boom has transformed its bottom line.


In this infographic, we map out internet usage by global region based on the latest data from the World Bank.


