Technology
The Stock Performance of U.S. Chipmakers So Far in 2024
![]() See this visualization first on the Voronoi app.
See this visualization first on the Voronoi app.
The Stock Performance of U.S. Chipmakers So Far in 2024
This was originally posted on our Voronoi app. Download the app for free on iOS or Android and discover incredible data-driven charts from a variety of trusted sources.
Is there anything more wanted than a chip stock right now? Four of the biggest U.S. chipmakers have accounted for a staggering one-third of the S&P 500 gains in 2024 so far.
But what does that look like for the individual companies?
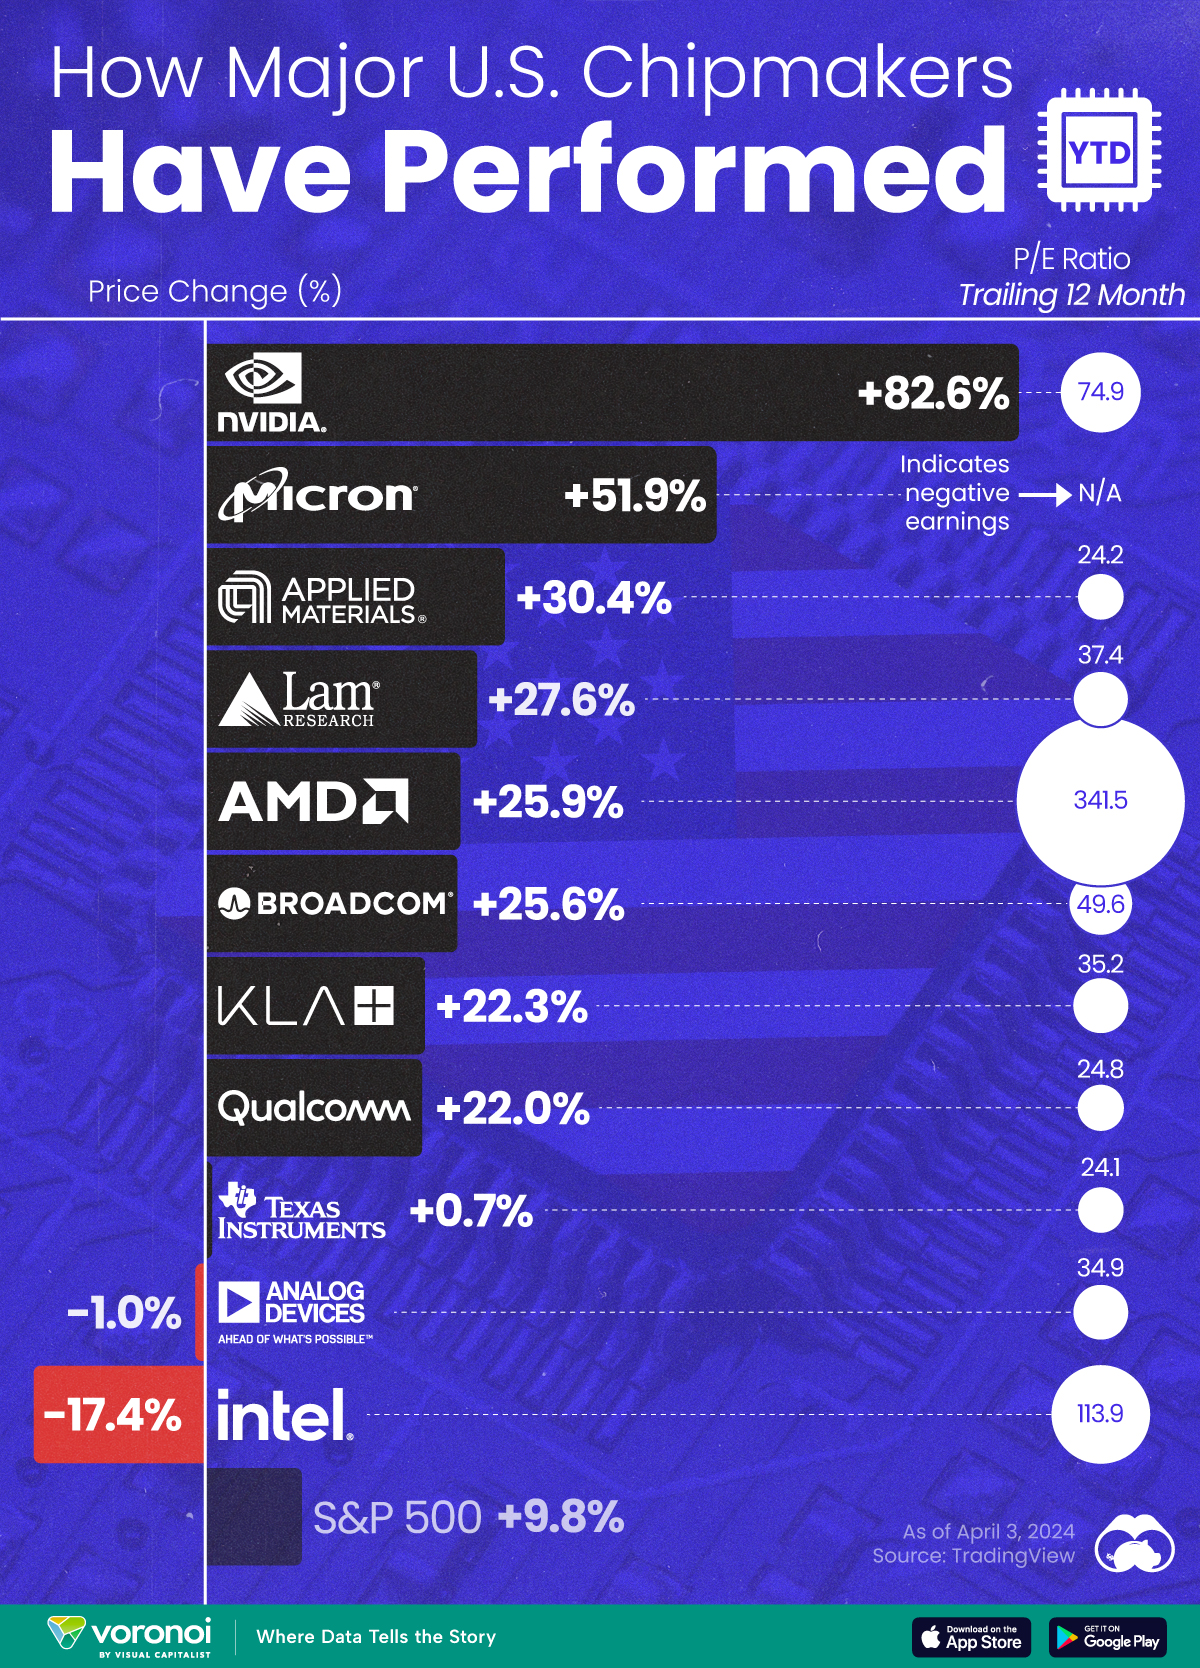
We visualize the year-to-date (YTD) stock performance of major American chipmakers, ranked by market cap. Price-earnings ratios (trailing 12 months) were included for additional context. Data is sourced from TradingView, current up to April 3rd, 2024.
America’s Biggest Chip Stocks See Strong Growth 2024
The Nvidia rocket ship is refusing to slow down; the stock is up almost 80% YTD in 2024. This is after its more than threefold rise last year, joining the trillion dollar club in May 2023.
However, Nvidia’s isn’t the only one amongst the big U.S. chipmakers to have a strong Q1 stock performance. Micron Technology (memory chips) and Applied Materials (manufacturing equipment) also posted big gains on Wall Street.
| Company | Price Change (Since Jan 1, 2024) | P/E Ratio (Trailing 12 Month) |
|---|---|---|
| Nvidia | 82.6% | 74.9 |
| Micron Technology | 51.9% | N/A |
| Applied Materials | 30.4% | 24.2 |
| Lam Research | 27.6% | 37.4 |
| AMD | 25.9% | 341.5 |
| Broadcom | 25.6% | 49.6 |
| KLA | 22.3% | 35.2 |
| Qualcomm | 22% | 24.79 |
| Texas Instruments | 0.7% | 24.1 |
| Analog Devices | -1% | 34.9 |
| Intel | -17.4% | 113.9 |
| S&P 500 | 9.8% | N/A |
Many of these firms have benefited from the ongoing AI craze, as well the U.S. government’s efforts to ramp-up domestic chipmaking capacity.
The one big outlier to this is Intel, who has been having a rough couple of years. Its foundry business—which makes chips for competitors—has been losing money, scaring off investors from a stock with an already fairly high P/E ratio.
What Does the P/E Ratio Tell Us?
The price-earnings ratio is the proportion of a company’s stock price to its earnings per share (EPS).
We’ve visualized the trailing 12 month (TTM) P/E ratio, which divides current stock price by EPS over the past 12 months. The one downside to this metric is some fundamental stock market wisdom—past performance doesn’t determine future earnings.
In terms of P/E ratios, AMD and Intel are the two outliers at 341.5 and 113.9 respectively. In AMD’s case, this means that investors are willing to pay $341.5 per $1 of earnings.
This is substantially higher than all of the other companies on this list, suggesting that investors expect AMD to grow a lot in the future.


Technology
All of the Grants Given by the U.S. CHIPS Act
Intel, TSMC, and more have received billions in subsidies from the U.S. CHIPS Act in 2024.


All of the Grants Given by the U.S. CHIPS Act
This was originally posted on our Voronoi app. Download the app for free on iOS or Android and discover incredible data-driven charts from a variety of trusted sources.
This visualization shows which companies are receiving grants from the U.S. CHIPS Act, as of April 25, 2024. The CHIPS Act is a federal statute signed into law by President Joe Biden that authorizes $280 billion in new funding to boost domestic research and manufacturing of semiconductors.
The grant amounts visualized in this graphic are intended to accelerate the production of semiconductor fabrication plants (fabs) across the United States.
Data and Company Highlights
The figures we used to create this graphic were collected from a variety of public news sources. The Semiconductor Industry Association (SIA) also maintains a tracker for CHIPS Act recipients, though at the time of writing it does not have the latest details for Micron.
| Company | Federal Grant Amount | Anticipated Investment From Company |
|---|---|---|
| 🇺🇸 Intel | $8,500,000,000 | $100,000,000,000 |
| 🇹🇼 TSMC | $6,600,000,000 | $65,000,000,000 |
| 🇰🇷 Samsung | $6,400,000,000 | $45,000,000,000 |
| 🇺🇸 Micron | $6,100,000,000 | $50,000,000,000 |
| 🇺🇸 GlobalFoundries | $1,500,000,000 | $12,000,000,000 |
| 🇺🇸 Microchip | $162,000,000 | N/A |
| 🇬🇧 BAE Systems | $35,000,000 | N/A |
BAE Systems was not included in the graphic due to size limitations
Intel’s Massive Plans
Intel is receiving the largest share of the pie, with $8.5 billion in grants (plus an additional $11 billion in government loans). This grant accounts for 22% of the CHIPS Act’s total subsidies for chip production.
From Intel’s side, the company is expected to invest $100 billion to construct new fabs in Arizona and Ohio, while modernizing and/or expanding existing fabs in Oregon and New Mexico. Intel could also claim another $25 billion in credits through the U.S. Treasury Department’s Investment Tax Credit.
TSMC Expands its U.S. Presence
TSMC, the world’s largest semiconductor foundry company, is receiving a hefty $6.6 billion to construct a new chip plant with three fabs in Arizona. The Taiwanese chipmaker is expected to invest $65 billion into the project.
The plant’s first fab will be up and running in the first half of 2025, leveraging 4 nm (nanometer) technology. According to TrendForce, the other fabs will produce chips on more advanced 3 nm and 2 nm processes.
The Latest Grant Goes to Micron
Micron, the only U.S.-based manufacturer of memory chips, is set to receive $6.1 billion in grants to support its plans of investing $50 billion through 2030. This investment will be used to construct new fabs in Idaho and New York.

-

 Demographics6 days ago
The Countries That Have Become Sadder Since 2010
-

 Green2 weeks ago
Ranked: The Countries With the Most Air Pollution in 2023
-

 Green2 weeks ago
Ranking the Top 15 Countries by Carbon Tax Revenue
-

 Markets2 weeks ago
U.S. Debt Interest Payments Reach $1 Trillion
-

 Mining2 weeks ago
Gold vs. S&P 500: Which Has Grown More Over Five Years?
-

 Energy2 weeks ago
The World’s Biggest Nuclear Energy Producers
-

 Misc2 weeks ago
How Hard Is It to Get Into an Ivy League School?
-

 Debt2 weeks ago
How Debt-to-GDP Ratios Have Changed Since 2000