Maps
Mapped: Population Growth by Region (1900-2050F)
![]() See this visualization first on the Voronoi app.
See this visualization first on the Voronoi app.
Mapping Population Growth by Region
This was originally posted on our Voronoi app. Download the app for free on iOS or Android and discover incredible data-driven charts from a variety of trusted sources.
In fewer than 50 years, the world population has doubled in size, jumping from 4 to 8 billion.
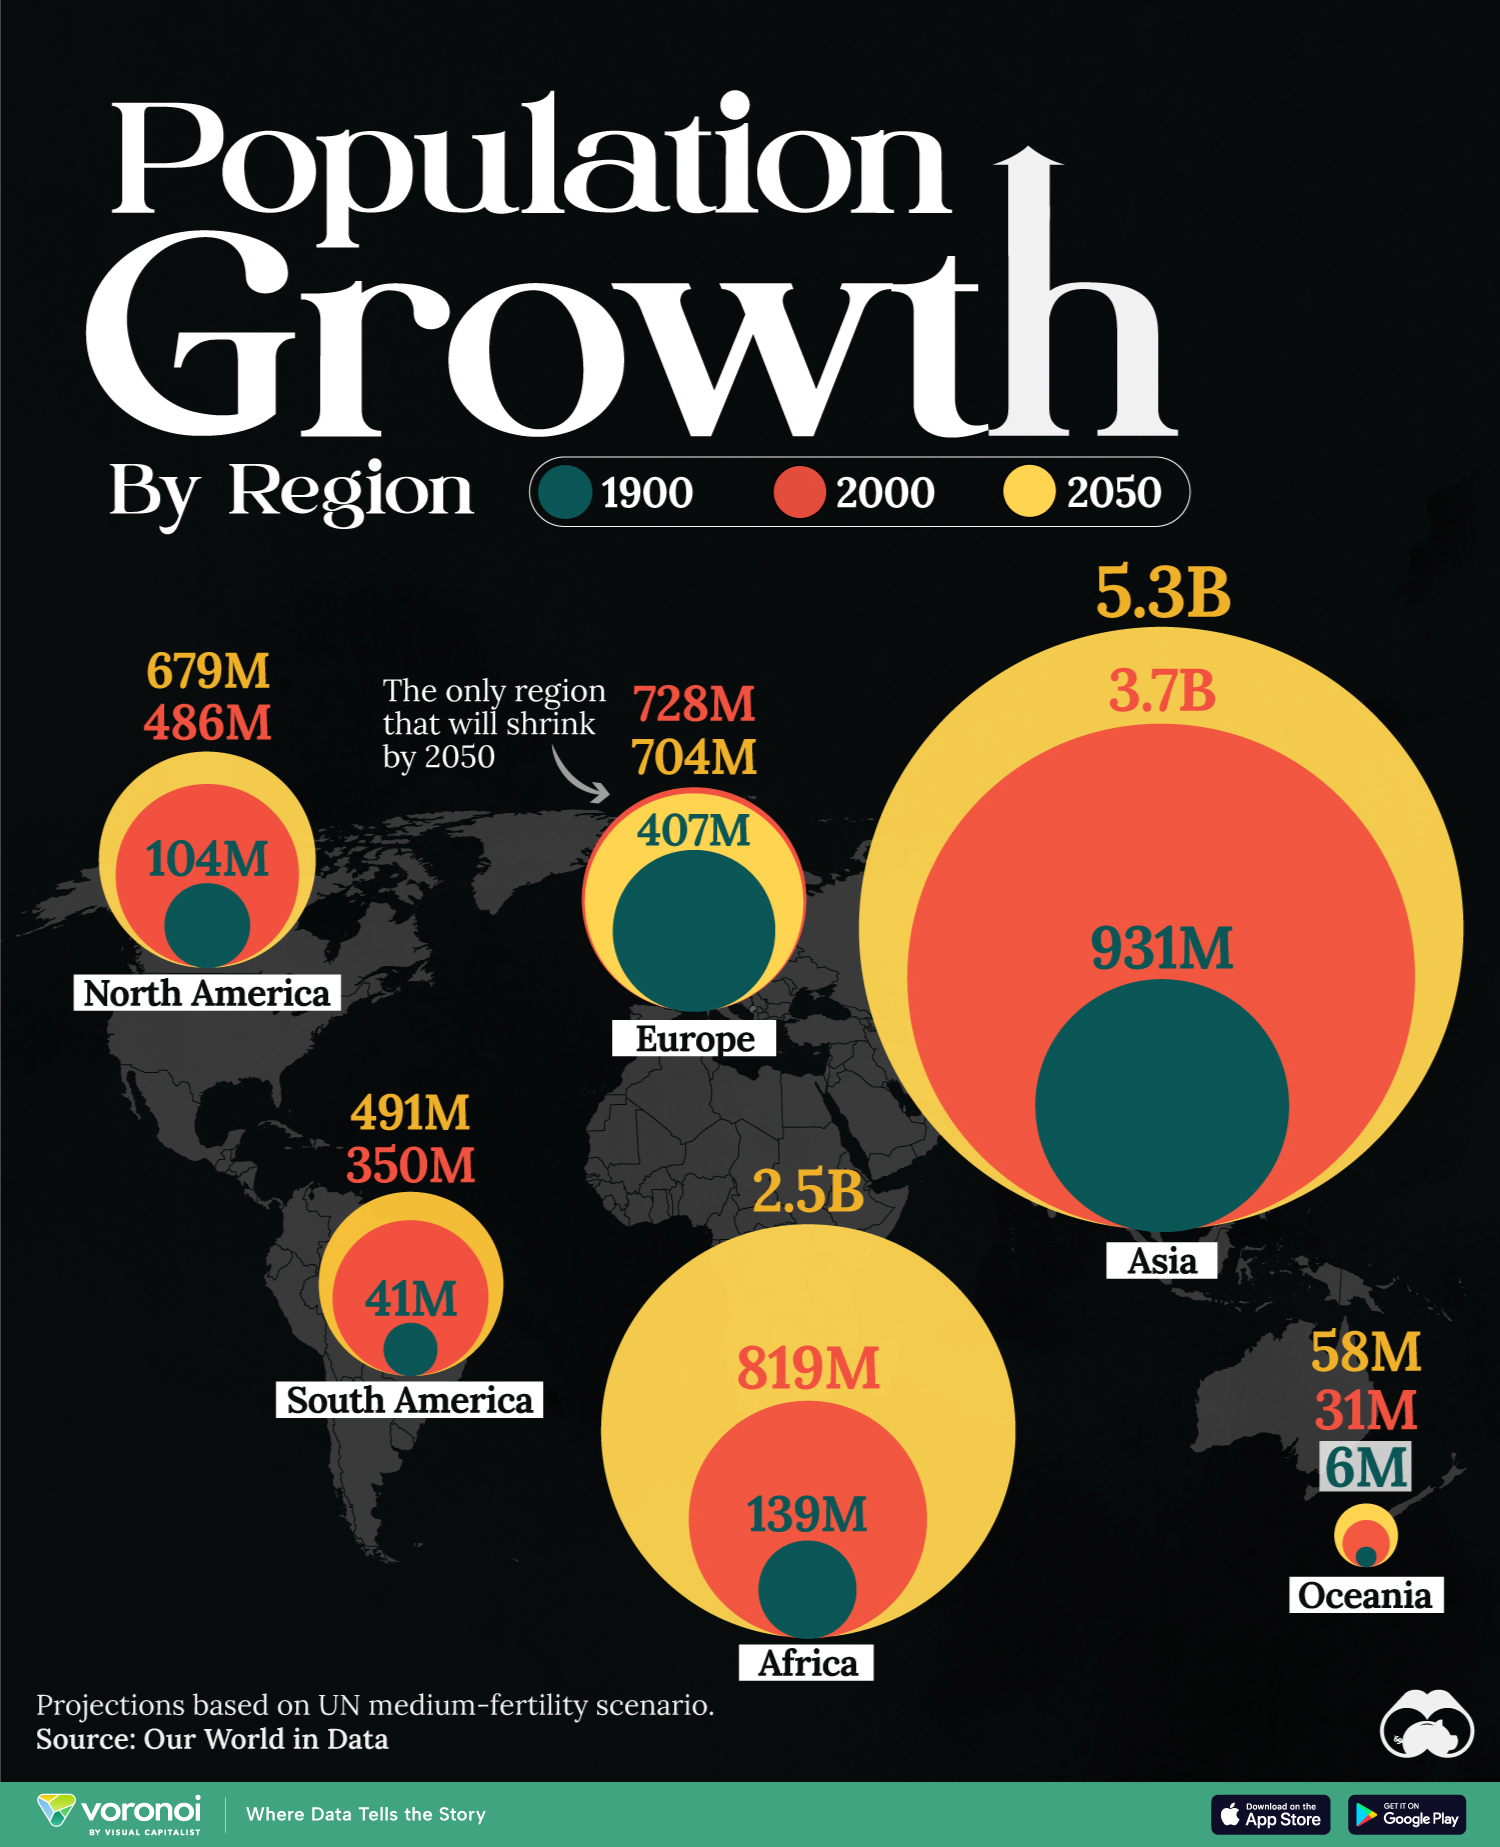
In this visualization, we map the populations of major regions at three different points in time: 1900, 2000, and 2050 (forecasted). Figures come from Our World in Data as of March 2023, using the United Nations medium-fertility scenario.
Population by Continent (1900-2050F)
Asia was the biggest driver of global population growth over the course of the 20th century. In fact, the continent’s population grew by 2.8 billion people from 1900 to 2000, compared to just 680 million from the second on our list, Africa.
| Region | 1900 | 2000 | 2050F |
|---|---|---|---|
| Asia | 931,021,418 | 3,735,089,775 | 5,291,555,919 |
| Africa | 138,752,199 | 818,952,374 | 2,485,135,689 |
| Europe | 406,610,221 | 727,917,165 | 704,398,730 |
| North America | 104,231,973 | 486,364,446 | 679,488,449 |
| South America | 41,330,704 | 349,634,344 | 491,078,697 |
| Oceania | 5,936,615 | 31,223,133 | 57,834,753 |
| World 🌐 | 1,627,883,130 | 6,149,181,237 | 9,709,492,237 |
China was the main source of Asia’s population expansion, though its population growth has slowed in recent years. That’s why in 2023, India surpassed China to become the world’s most populous country.
Southeast Asian countries like the Philippines and Indonesia have also been big drivers of Asia’s population boom to this point.
The Future: Africa to Hit 2.5 Billion by 2050
Under the UN’s medium-fertility scenario (all countries converge at a birthrate of 1.85 children per woman by 2050), Africa will solidify its place as the world’s second most populous region.
Three countries—Nigeria, Ethiopia, and Egypt—will account for roughly 30% of that 2.5 billion population figure.
Meanwhile, both North America and South America are expected to see a slowdown in population growth, while Europe is the only region that will shrink by 2050.
A century ago, Europe’s population was close to 30% of the world total. Today, that figure stands at less than 10%.


Maps
The Largest Earthquakes in the New York Area (1970-2024)
The earthquake that shook buildings across New York in April 2024 was the third-largest quake in the Northeast U.S. over the past 50 years.


The Largest Earthquakes in the New York Area
This was originally posted on our Voronoi app. Download the app for free on Apple or Android and discover incredible data-driven charts from a variety of trusted sources.
The 4.8 magnitude earthquake that shook buildings across New York on Friday, April 5th, 2024 was the third-largest quake in the U.S. Northeast area over the past 50 years.
In this map, we illustrate earthquakes with a magnitude of 4.0 or greater recorded in the Northeastern U.S. since 1970, according to the United States Geological Survey (USGS).
Shallow Quakes and Older Buildings
The earthquake that struck the U.S. Northeast in April 2024 was felt by millions of people from Washington, D.C., to north of Boston. It even caused a full ground stop at Newark Airport.
The quake, occurring just 5 km beneath the Earth’s surface, was considered shallow, which is what contributed to more intense shaking at the surface.
According to the USGS, rocks in the eastern U.S. are significantly older, denser, and harder than those on the western side, compressed by time. This makes them more efficient conduits for seismic energy. Additionally, buildings in the Northeast tend to be older and may not adhere to the latest earthquake codes.
Despite disrupting work and school life, the earthquake was considered minor, according to the Michigan Technological University magnitude scale:
| Magnitude | Earthquake Effects | Estimated Number Each Year |
|---|---|---|
| 2.5 or less | Usually not felt, but can be recorded by seismograph. | Millions |
| 2.5 to 5.4 | Often felt, but only causes minor damage. | 500,000 |
| 5.5 to 6.0 | Slight damage to buildings and other structures. | 350 |
| 6.1 to 6.9 | May cause a lot of damage in very populated areas. | 100 |
| 7.0 to 7.9 | Major earthquake. Serious damage. | 10-15 |
| 8.0 or greater | Great earthquake. Can totally destroy communities near the epicenter. | One every year or two |
The largest earthquake felt in the area over the past 50 years was a 5.3 magnitude quake that occurred in Au Sable Forks, New York, in 2002. It damaged houses and cracked roads in a remote corner of the Adirondack Mountains, but caused no injuries.
| Date | Magnitude | Location | State |
|---|---|---|---|
| April 20, 2002 | 5.3 | Au Sable Forks | New York |
| October 7, 1983 | 5.1 | Newcomb | New York |
| April 5, 2024 | 4.8 | Whitehouse Station | New Jersey |
| October 16, 2012 | 4.7 | Hollis Center | Maine |
| January 16, 1994 | 4.6 | Sinking Spring | Pennsylvania |
| January 19, 1982 | 4.5 | Sanbornton | New Hampshire |
| September 25, 1998 | 4.5 | Adamsville | Pennsylvania |
| June 9, 1975 | 4.2 | Altona | New York |
| May 29, 1983 | 4.2 | Peru | Maine |
| April 23, 1984 | 4.2 | Conestoga | Pennsylvania |
| January 16, 1994 | 4.2 | Sinking Spring | Pennsylvania |
| November 3, 1975 | 4 | Long Lake | New York |
| June 17, 1991 | 4 | Worcester | New York |
The largest earthquake in U.S. history, however, was the 1964 Good Friday quake in Alaska, measuring 9.2 magnitude and killing 131 people.

-

 Education1 week ago
How Hard Is It to Get Into an Ivy League School?
-

 Technology2 weeks ago
Ranked: Semiconductor Companies by Industry Revenue Share
-

 Markets2 weeks ago
Ranked: The World’s Top Flight Routes, by Revenue
-

 Demographics2 weeks ago
Population Projections: The World’s 6 Largest Countries in 2075
-

 Markets2 weeks ago
The Top 10 States by Real GDP Growth in 2023
-

 Demographics2 weeks ago
The Smallest Gender Wage Gaps in OECD Countries
-

 Economy2 weeks ago
Where U.S. Inflation Hit the Hardest in March 2024
-

 Green2 weeks ago
Top Countries By Forest Growth Since 2001