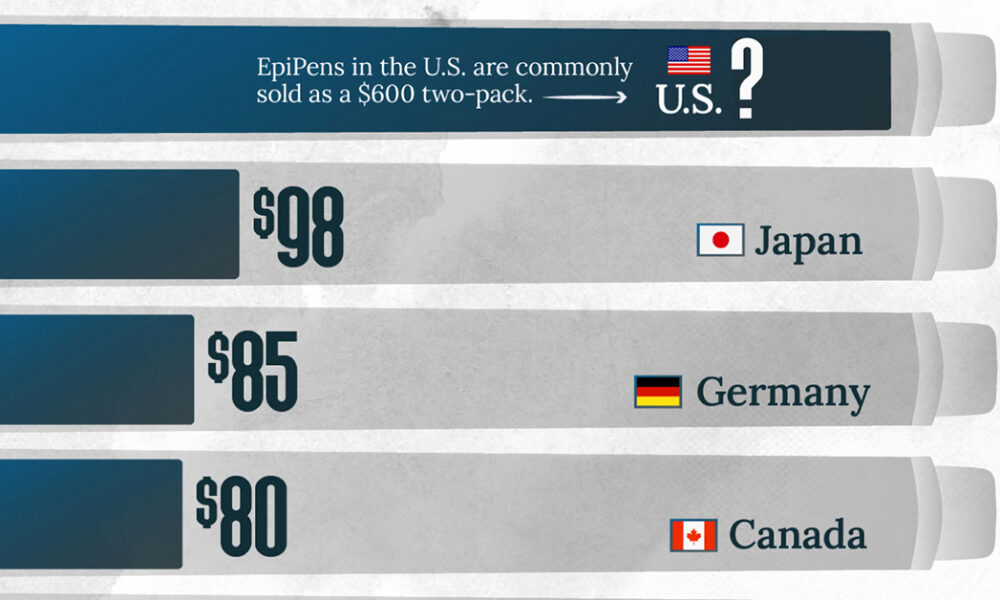
This visualization compares EpiPen prices around the world, with the U.S. having the highest prices by far.

This visual shows tobacco use by country and sex, highlighting which countries still have a high prevalence of smoking.


From Eli Lilly to Pfizer, this graphic shows the largest pharmaceutical companies around the world by region.


The human gut microbiome contains a world of microbes. We look at the the bacteria that deeply affect our health and well-being.

These graphics reveal how many people get depression over the course of their lives, broken down by age and sex.
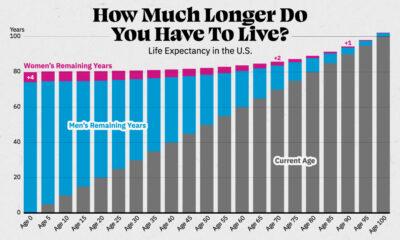

Visualizing the number of years left to live for Americans at every age, reveals the broader trends in American life expectancy.


This visual highlights the cost of insulin by country, showing how much more expensive diabetes medicine is in the U.S.
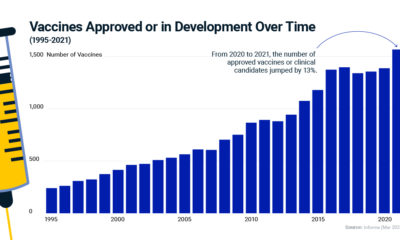

Vaccine development has grown six-fold since 1995. Learn how virology, the study of viruses, is driving innovation in the healthcare industry.
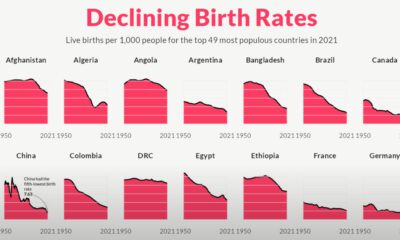

For the last 70 years, birth rates for the 49 most populous countries of the world have fallen sharply, heralding an uncertain future.
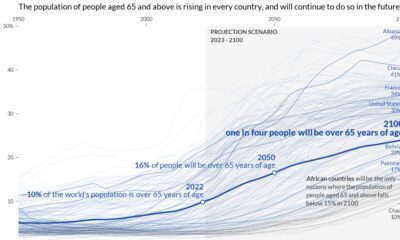

This graphic visualizes the world’s aging population, showing data for every country and territory around the world.


 Creator Program