Markets
The World’s 50 Largest Pharmaceutical Companies
Article/Editing:
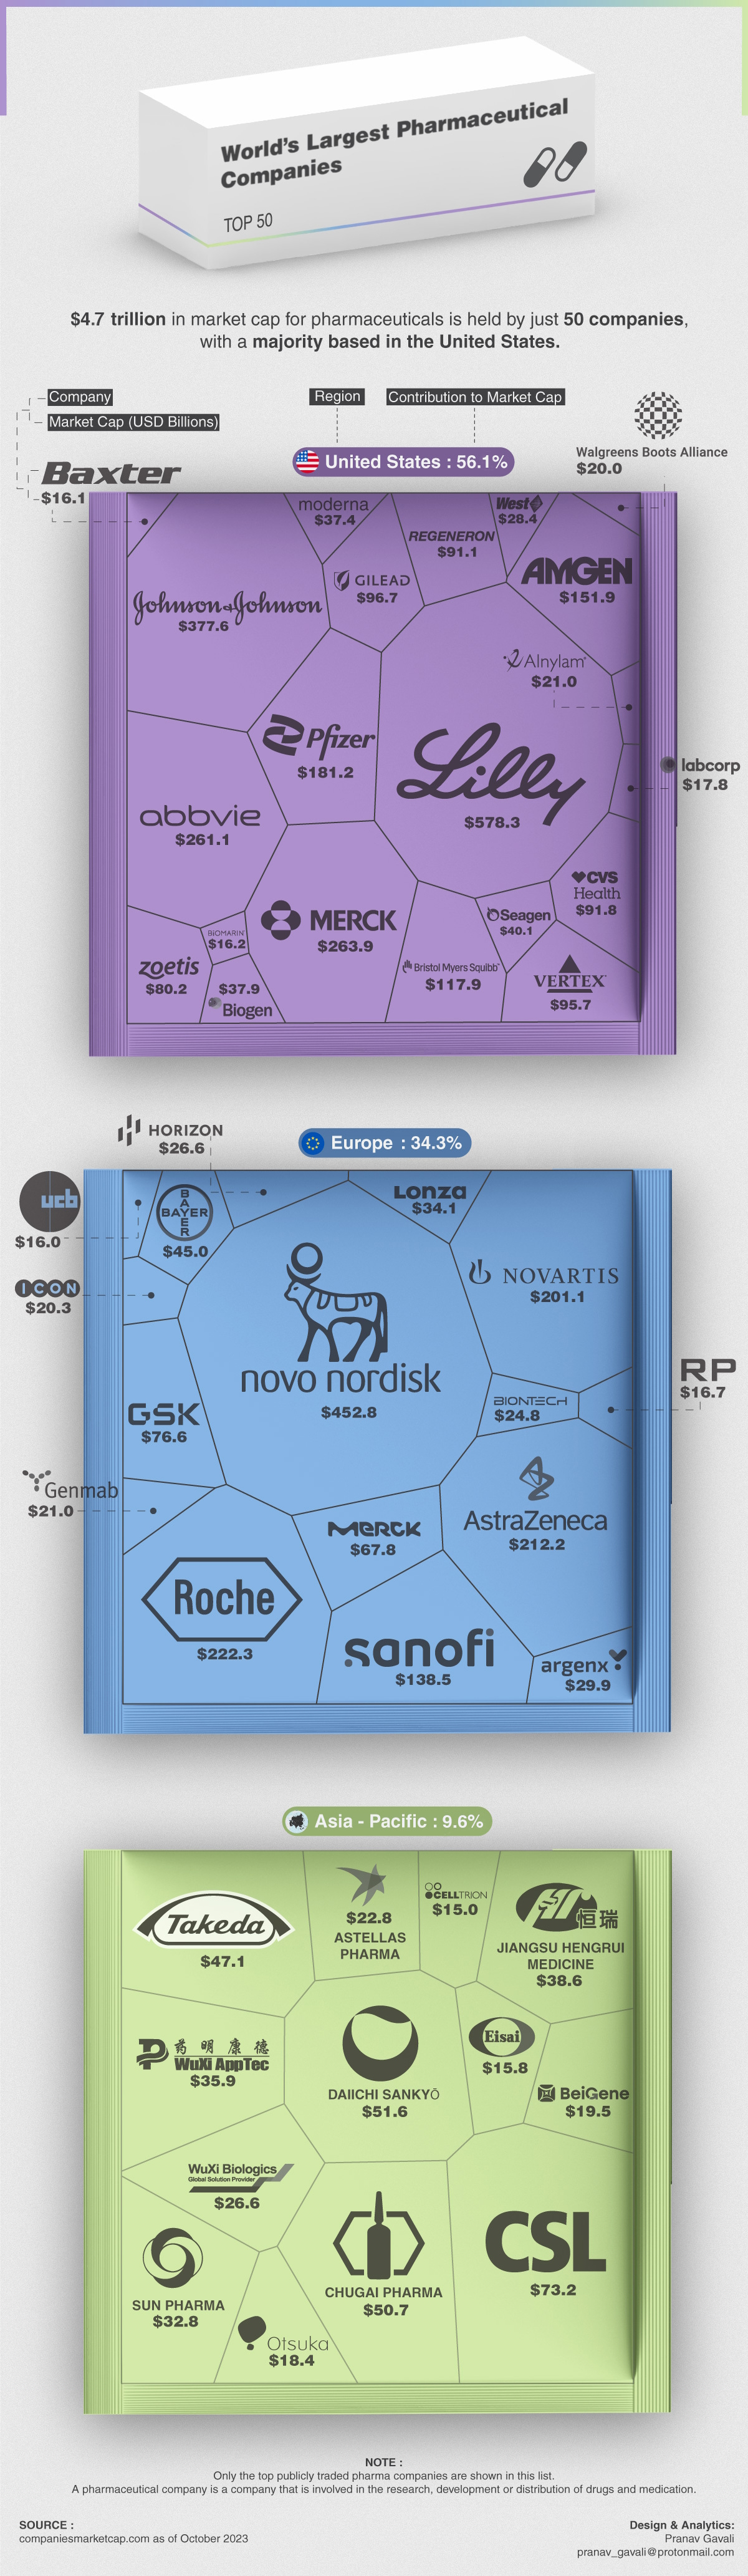
The World’s 50 Largest Pharmaceutical Companies
Globally, big pharma revenues have grown by more than half a trillion dollars since 2012, driven by an aging global population.
American drugmakers make up the greatest market share worldwide by far, supported by high prices in a less regulated market. Yet with 190 drug patents expiring in the next decade, many companies face steep revenue losses at the hands of generic competitors.
This graphic, from Pranav Gavali, shows the largest pharmaceutical companies in the world.
Ranked: The Top 50 Pharmaceutical Giants
Together, the 50 biggest drugmakers make up a combined $4.7 trillion in market capitalization.
With a market cap of over $578 billion, American pharmaceutical company Eli Lilly is the world’s most valuable, known for diabetes medications and its newly-launched weight-loss drug. The average price of insulin in the U.S. is more than five times higher than other countries.
| Ranking | Name | Symbol | Market Cap Oct 16 2023 | Country |
|---|---|---|---|---|
| 1 | Eli Lilly | LLY | $578.3B | 🇺🇸 U.S. |
| 2 | Novo Nordisk | NVO | $452.8B | 🇩🇰 Denmark |
| 3 | Johnson & Johnson | JNJ | $377.7B | 🇺🇸 U.S. |
| 4 | Merck | MRK | $263.9B | 🇺🇸 U.S. |
| 5 | AbbVie | ABBV | $261.2B | 🇺🇸 U.S. |
| 6 | Roche | ROG.SW | $222.4B | 🇨🇭 Switzerland |
| 7 | AstraZeneca | AZN | $212.2B | 🇬🇧 UK |
| 8 | Novartis | NVS | $201.1B | 🇨🇭 Switzerland |
| 9 | Pfizer | PFE | $181.3B | 🇺🇸 U.S. |
| 10 | Amgen | AMGN | $152.0B | 🇺🇸 U.S. |
| 11 | Sanofi | SNY | $138.5B | 🇫🇷 France |
| 12 | Bristol-Myers Squibb | BMY | $118.0B | 🇺🇸 U.S. |
| 13 | Gilead Sciences | GILD | $96.8B | 🇺🇸 U.S. |
| 14 | Vertex Pharmaceuticals | VRTX | $95.8B | 🇺🇸 U.S. |
| 15 | CVS Health | CVS | $91.9B | 🇺🇸 U.S. |
| 16 | Regeneron Pharmaceuticals | REGN | $91.1B | 🇺🇸 U.S. |
| 17 | Zoetis | ZTS | $80.3B | 🇺🇸 U.S. |
| 18 | GlaxoSmithKline | GSK | $76.6B | 🇬🇧 UK |
| 19 | CSL | CSL.AX | $73.3B | 🇦🇺 Australia |
| 20 | Merck KGaA | MRK.DE | $67.8B | 🇩🇪 Germany |
| 21 | Daiichi Sankyō | 4568.T | $51.7B | 🇯🇵 Japan |
| 22 | Chugai Pharmaceutical | 4519.T | $50.8B | 🇯🇵 Japan |
| 23 | Takeda Pharmaceutical | TAK | $47.2B | 🇯🇵 Japan |
| 24 | Bayer | BAYZF | $45.1B | 🇩🇪 Germany |
| 25 | Seagen | SGEN | $40.2B | 🇺🇸 U.S. |
| 26 | Jiangsu Hengrui Medicine | 600276.SS | $38.6B | 🇨🇳 China |
| 27 | Biogen | BIIB | $38.0B | 🇺🇸 U.S. |
| 28 | Moderna | MRNA | $37.4B | 🇺🇸 U.S. |
| 29 | WuXi AppTec | 2359.HK | $36.0B | 🇨🇳 China |
| 30 | Lonza | LONN.SW | $34.2B | 🇨🇭 Switzerland |
| 31 | Sun Pharmaceutical | SUNPHARMA.NS | $32.8B | 🇮🇳 India |
| 32 | Argenx | ARGX | $29.9B | 🇳🇱 Netherlands |
| 33 | West Pharmaceutical | WST | $28.4B | 🇺🇸 U.S. |
| 34 | WuXi Biologics | WXXWY | $26.7B | 🇨🇳 China |
| 35 | Horizon Therapeutics | HZNP | $26.6B | 🇮🇪 Ireland |
| 36 | BioNTech | BNTX | $24.8B | 🇩🇪 Germany |
| 37 | Astellas Pharma | 4503.T | $22.9B | 🇯🇵 Japan |
| 38 | Genmab | GMAB | $21.1B | 🇩🇰 Denmark |
| 39 | Alnylam Pharmaceuticals | ALNY | $21.0B | 🇺🇸 U.S. |
| 40 | ICON plc | ICLR | $20.3B | 🇮🇪 Ireland |
| 41 | Walgreens Boots Alliance | WBA | $20.1B | 🇺🇸 U.S. |
| 42 | BeiGene | BGNE | $19.5B | 🇨🇳 China |
| 43 | Otsuka Holdings | 4578.T | $18.4B | 🇯🇵 Japan |
| 44 | LabCorp | LH | $17.9B | 🇺🇸 U.S. |
| 45 | Royalty Pharma | RPRX | $16.8B | 🇬🇧 UK |
| 46 | BioMarin Pharmaceutical | BMRN | $16.2B | 🇺🇸 U.S. |
| 47 | Baxter | BAX | $16.1B | 🇺🇸 U.S. |
| 48 | UCB | UCB.VI | $16.0B | 🇧🇪 Belgium |
| 49 | Eisai | 4523.T | $15.9B | 🇯🇵 Japan |
| 50 | Celltrion | 068270.KS | $15.0B | 🇰🇷 South Korea |
Ranking in second is Denmark’s Novo Nordisk, with a $453 billion market cap.
The 100-year old company began by making insulin, a newly discovered drug in the 1920s. Like Eli Lilly, it recently launched a weight-loss drug, Ozempic, originally used to treat diabetes. As drug sales soared, the company briefly became the most valuable in Europe.
According to BMO, the weight-loss drug market will be worth $100 billion by 2035.
As a major drug exporter to the U.S., Japan is home to the largest pharma companies in Asia. In fact, it is the third-largest pharmaceutical market in the world. A number of large U.S. pharma companies including Eli Lilly, Pfizer, and Bristol Myers Squibb have subsidiaries in the country.
Of the top 50 pharma companies, U.S. drugmakers make up 56% of global market capitalization, followed by Europe at 34%, and Asia with a 10% market share.
Facing a Cliff
With scores of patents set to expire by 2030, big pharma companies could see a $200 billion loss in revenues due to fierce competition from generics.
As a result, the 10 largest pharmaceutical companies globally are at risk of losing 46% of revenues. Adding to this, the U.S. government announced they may remove patent protection if certain drugs are too expensive in efforts to clamp down on high drug prices.
This may come as a benefit to consumers, especially in America. With some of the highest prescription costs in the world, they are as much as three times more expensive than other countries, averaging $1,432 per person in 2021.
The median price for newly-launched drugs in the U.S. in 2022 was over $200,000 per year—up from $2,115 in 2008.

This article was published as a part of Visual Capitalist's Creator Program, which features data-driven visuals from some of our favorite Creators around the world.


Economy
Economic Growth Forecasts for G7 and BRICS Countries in 2024
The IMF has released its economic growth forecasts for 2024. How do the G7 and BRICS countries compare?


G7 & BRICS Real GDP Growth Forecasts for 2024
The International Monetary Fund’s (IMF) has released its real gross domestic product (GDP) growth forecasts for 2024, and while global growth is projected to stay steady at 3.2%, various major nations are seeing declining forecasts.
This chart visualizes the 2024 real GDP growth forecasts using data from the IMF’s 2024 World Economic Outlook for G7 and BRICS member nations along with Saudi Arabia, which is still considering an invitation to join the bloc.
Get the Key Insights of the IMF’s World Economic Outlook
Want a visual breakdown of the insights from the IMF’s 2024 World Economic Outlook report?
This visual is part of a special dispatch of the key takeaways exclusively for VC+ members.
Get the full dispatch of charts by signing up to VC+.
Mixed Economic Growth Prospects for Major Nations in 2024
Economic growth projections by the IMF for major nations are mixed, with the majority of G7 and BRICS countries forecasted to have slower growth in 2024 compared to 2023.
Only three BRICS-invited or member countries, Saudi Arabia, the UAE, and South Africa, have higher projected real GDP growth rates in 2024 than last year.
| Group | Country | Real GDP Growth (2023) | Real GDP Growth (2024P) |
|---|---|---|---|
| G7 | 🇺🇸 U.S. | 2.5% | 2.7% |
| G7 | 🇨🇦 Canada | 1.1% | 1.2% |
| G7 | 🇯🇵 Japan | 1.9% | 0.9% |
| G7 | 🇫🇷 France | 0.9% | 0.7% |
| G7 | 🇮🇹 Italy | 0.9% | 0.7% |
| G7 | 🇬🇧 UK | 0.1% | 0.5% |
| G7 | 🇩🇪 Germany | -0.3% | 0.2% |
| BRICS | 🇮🇳 India | 7.8% | 6.8% |
| BRICS | 🇨🇳 China | 5.2% | 4.6% |
| BRICS | 🇦🇪 UAE | 3.4% | 3.5% |
| BRICS | 🇮🇷 Iran | 4.7% | 3.3% |
| BRICS | 🇷🇺 Russia | 3.6% | 3.2% |
| BRICS | 🇪🇬 Egypt | 3.8% | 3.0% |
| BRICS-invited | 🇸🇦 Saudi Arabia | -0.8% | 2.6% |
| BRICS | 🇧🇷 Brazil | 2.9% | 2.2% |
| BRICS | 🇿🇦 South Africa | 0.6% | 0.9% |
| BRICS | 🇪🇹 Ethiopia | 7.2% | 6.2% |
| 🌍 World | 3.2% | 3.2% |
China and India are forecasted to maintain relatively high growth rates in 2024 at 4.6% and 6.8% respectively, but compared to the previous year, China is growing 0.6 percentage points slower while India is an entire percentage point slower.
On the other hand, four G7 nations are set to grow faster than last year, which includes Germany making its comeback from its negative real GDP growth of -0.3% in 2023.
Faster Growth for BRICS than G7 Nations
Despite mostly lower growth forecasts in 2024 compared to 2023, BRICS nations still have a significantly higher average growth forecast at 3.6% compared to the G7 average of 1%.
While the G7 countries’ combined GDP is around $15 trillion greater than the BRICS nations, with continued higher growth rates and the potential to add more members, BRICS looks likely to overtake the G7 in economic size within two decades.
BRICS Expansion Stutters Before October 2024 Summit
BRICS’ recent expansion has stuttered slightly, as Argentina’s newly-elected president Javier Milei declined its invitation and Saudi Arabia clarified that the country is still considering its invitation and has not joined BRICS yet.
Even with these initial growing pains, South Africa’s Foreign Minister Naledi Pandor told reporters in February that 34 different countries have submitted applications to join the growing BRICS bloc.
Any changes to the group are likely to be announced leading up to or at the 2024 BRICS summit which takes place October 22-24 in Kazan, Russia.
Get the Full Analysis of the IMF’s Outlook on VC+
This visual is part of an exclusive special dispatch for VC+ members which breaks down the key takeaways from the IMF’s 2024 World Economic Outlook.
For the full set of charts and analysis, sign up for VC+.

-

 Debt1 week ago
How Debt-to-GDP Ratios Have Changed Since 2000
-

 Countries2 weeks ago
Population Projections: The World’s 6 Largest Countries in 2075
-

 Markets2 weeks ago
The Top 10 States by Real GDP Growth in 2023
-

 Demographics2 weeks ago
The Smallest Gender Wage Gaps in OECD Countries
-

 United States2 weeks ago
Where U.S. Inflation Hit the Hardest in March 2024
-

 Green2 weeks ago
Top Countries By Forest Growth Since 2001
-

 United States2 weeks ago
Ranked: The Largest U.S. Corporations by Number of Employees
-

 Maps2 weeks ago
The Largest Earthquakes in the New York Area (1970-2024)