Green
Top Countries By Forest Growth Since 2001
![]() See this visualization first on the Voronoi app.
See this visualization first on the Voronoi app.
Ranked: Top Countries By Forest Growth Since 2001
This was originally posted on our Voronoi app. Download the app for free on Apple or Android and discover incredible data-driven charts from a variety of trusted sources.
Reforestation is tricky business: it’s expensive, difficult to plan, and even harder to execute. And this is without all the associated environmental obstacles: weather, pests, and natural calamities.
However, some countries have prioritized replanting their lost forests, especially in the last two decades as the climate movement has gathered steam.
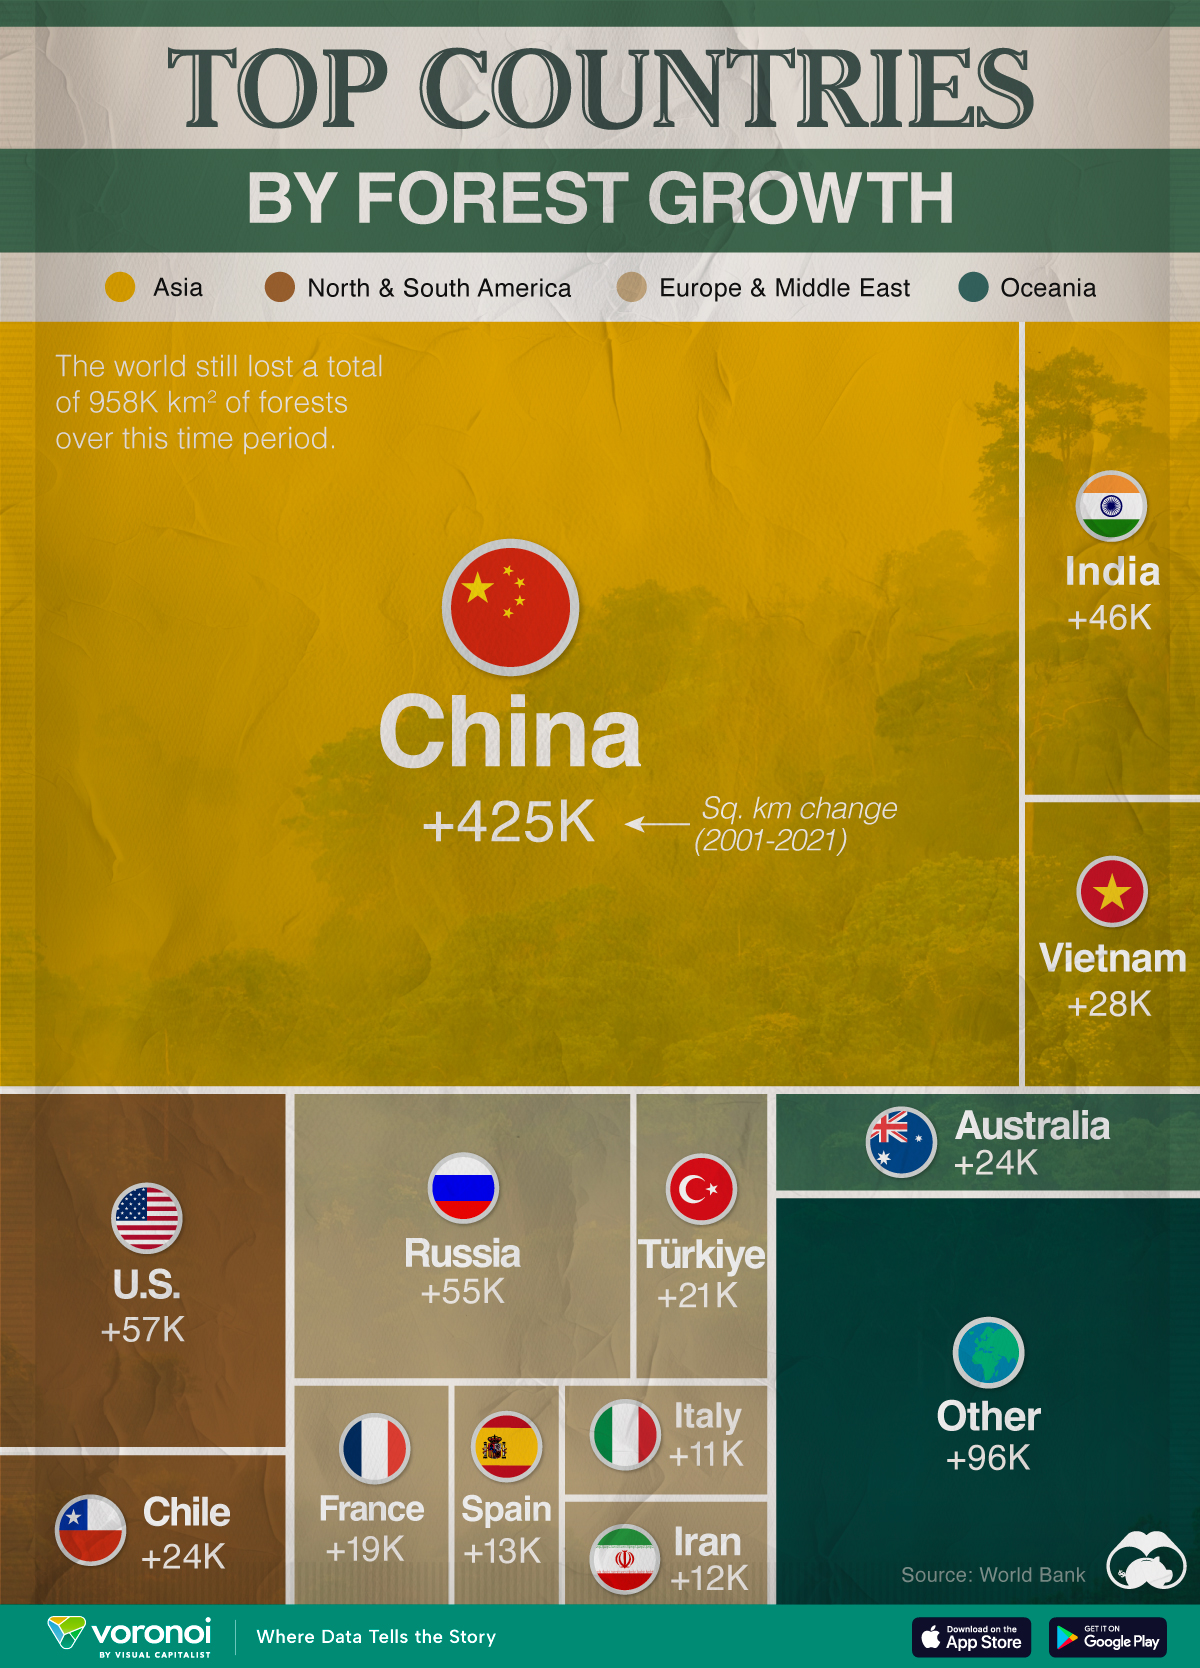
We visualized forest growth around the world, ranking countries by their forest area increases between 2001–2021, measured in square kilometers (km²).
All of this data was sourced from the World Bank. Note that countries are ranked by forest growth in square kilometers, rather than percentage change.
Which Country Leads Forest Growth Since 2001?
China tops the list, expanding its forest area by nearly 425,000 km2 (roughly the size of Sweden) between 2001–21. This is more than the next 19 countries combined. Relatively speaking, China’s forests increased by almost one-fourth.
| Rank | Country | Region | 2001–21 Change (Km2) | % of Forest Growth |
|---|---|---|---|---|
| 1 | 🇨🇳 China | Asia | 424,962 | 24% |
| 2 | 🇺🇸 U.S. | North America | 57,406 | 2% |
| 3 | 🇷🇺 Russia | Europe | 54,564 | 1% |
| 4 | 🇮🇳 India | Asia | 46,449 | 7% |
| 5 | 🇻🇳 Vietnam | Asia | 27,745 | 23% |
| 6 | 🇨🇱 Chile | South America | 24,257 | 15% |
| 7 | 🇦🇺 Australia | Oceania | 24,178 | 2% |
| 8 | 🇹🇷 Turkiye | Middle East | 21,345 | 11% |
| 9 | 🇫🇷 France | Europe | 19,353 | 13% |
| 10 | 🇪🇸 Spain | Europe | 13,374 | 8% |
| 11 | 🇮🇷 Iran | Middle East | 13,033 | 14% |
| 12 | 🇮🇹 Italy | Europe | 11,848 | 14% |
| 13 | 🇨🇺 Cuba | Central America | 7,573 | 30% |
| 14 | 🇹🇭 Thailand | Asia | 7,315 | 4% |
| 15 | 🇺🇿 Uzbekistan | Asia | 7,152 | 24% |
| 16 | 🇺🇾 Uruguay | South America | 6,468 | 46% |
| 17 | 🇷🇴 Romania | Europe | 5,482 | 9% |
| 18 | 🇧🇬 Bulgaria | Europe | 4,948 | 15% |
| 19 | 🇧🇾 Belarus | Europe | 4,734 | 6% |
| 20 | 🇵🇱 Poland | Europe | 4,090 | 5% |
| N/A | 🌍 World | -957,658 | -2% |
There are some other countries who have achieved similar relative levels of reforestation. Within Asia, Vietnam’s forests as a percentage of total land area have doubled since 1990. Since 2001, its forests have grown nearly 28,000 km², a 23% increase.
Uzbekistan similarly expanded its forested area by 24%, which amounts to about 7,000 km².
Meanwhile, Chile and Uruguay, are the only two South American countries that have managed to expand their forest cover in the last two decades—the latter by a staggering 46%. In contrast, the rest of South America is instead seeing significant deforestation.
It’s interesting to note that reforestation also comes with its own risks. Introducing non-native or monoculture tree species can reduce biodiversity and lead to soil erosion.
And despite global reforestation efforts, the world still lost close to a million square kilometers of forests since 2001.


Green
The Carbon Footprint of Major Travel Methods
Going on a cruise ship and flying domestically are the most carbon-intensive travel methods.


The Carbon Footprint of Major Travel Methods
This was originally posted on our Voronoi app. Download the app for free on iOS or Android and discover incredible data-driven charts from a variety of trusted sources.
Did you know that transport accounts for nearly one-quarter of global energy-related carbon dioxide (CO₂) emissions?
This graphic illustrates the carbon footprints of major travel methods measured in grams of carbon dioxide equivalent (CO₂e) emitted per person to travel one kilometer. This includes both CO₂ and other greenhouse gases.
Data is sourced from Our World in Data, the UK Government’s Department for Energy Security and Net Zero, and The International Council on Clean Transportation, as of December 2022.
These figures should be interpreted as approximations, rather than exact numbers. There are many variables at play that determine the actual carbon footprint in any individual case, including vehicle type or model, occupancy, energy mix, and even weather.
Cruise Ships are the Most Carbon-Intensive Travel Method
According to these estimates, taking a cruise ship, flying domestically, and driving alone are some of the most carbon-intensive travel methods.
Cruise ships typically use heavy fuel oil, which is high in carbon content. The average cruise ship weighs between 70,000 to 180,000 metric tons, meaning they require large engines to get moving.
These massive vessels must also generate power for onboard amenities such as lighting, air conditioning, and entertainment systems.
Short-haul flights are also considered carbon-intensive due to the significant amount of fuel consumed during initial takeoff and climbing altitude, relative to a lower amount of cruising.
| Transportation method | CO₂ equivalent emissions per passenger km |
|---|---|
| Cruise Ship | 250 |
| Short-haul flight (i.e. within a U.S. state or European country) | 246 |
| Diesel car | 171 |
| Gas car | 170 |
| Medium-haul flight (i.e. international travel within Europe, or between U.S. states) | 151 |
| Long-haul flight (over 3,700 km, about the distance from LA to NY) | 147 |
| Motorbike | 113 |
| Bus (average) | 96 |
| Plug-in hybrid | 68 |
| Electric car | 47 |
| National rail | 35 |
| Tram | 28 |
| London Underground | 27 |
| Ferry (foot passenger) | 19 |
| Eurostar (International rail) | 4.5 |
Are EVs Greener?
Many experts agree that EVs produce a lower carbon footprint over time versus traditional internal combustion engine (ICE) vehicles.
However, the batteries in electric vehicles charge on the power that comes straight off the electrical grid—which in many places may be powered by fossil fuels. For that reason, the carbon footprint of an EV will depend largely on the blend of electricity sources used for charging.
There are also questions about how energy-intensive it is to build EVs compared to a comparable ICE vehicle.

-

 Demographics6 days ago
The Countries That Have Become Sadder Since 2010
-

 Green2 weeks ago
Ranked: The Countries With the Most Air Pollution in 2023
-

 Green2 weeks ago
Ranking the Top 15 Countries by Carbon Tax Revenue
-

 Markets2 weeks ago
U.S. Debt Interest Payments Reach $1 Trillion
-

 Mining2 weeks ago
Gold vs. S&P 500: Which Has Grown More Over Five Years?
-

 Energy2 weeks ago
The World’s Biggest Nuclear Energy Producers
-

 Misc2 weeks ago
How Hard Is It to Get Into an Ivy League School?
-

 Debt2 weeks ago
How Debt-to-GDP Ratios Have Changed Since 2000