Energy
Life Cycle Emissions: EVs vs. Combustion Engine Vehicles
![]() Subscribe to the Elements free mailing list for more like this
Subscribe to the Elements free mailing list for more like this


Life Cycle Emissions: EVs vs. Combustion Engine Vehicles
This was originally posted on Elements. Sign up to the free mailing list to get beautiful visualizations on real assets and resource megatrends each week.
According to the International Energy Agency, the transportation sector is more reliant on fossil fuels than any other sector in the economy. In 2021, it accounted for 37% of all CO2 emissions from end‐use sectors.
To gain insights into how different vehicle types contribute to these emissions, the above graphic visualizes the life cycle emissions of battery electric, hybrid, and internal combustion engine (ICE) vehicles using Polestar and Rivian’s Pathway Report.
Production to Disposal: Emissions at Each Stage
Life cycle emissions are the total amount of greenhouse gases emitted throughout a product’s existence, including its production, use, and disposal.
To compare these emissions effectively, a standardized unit called metric tons of CO2 equivalent (tCO2e) is used, which accounts for different types of greenhouse gases and their global warming potential.
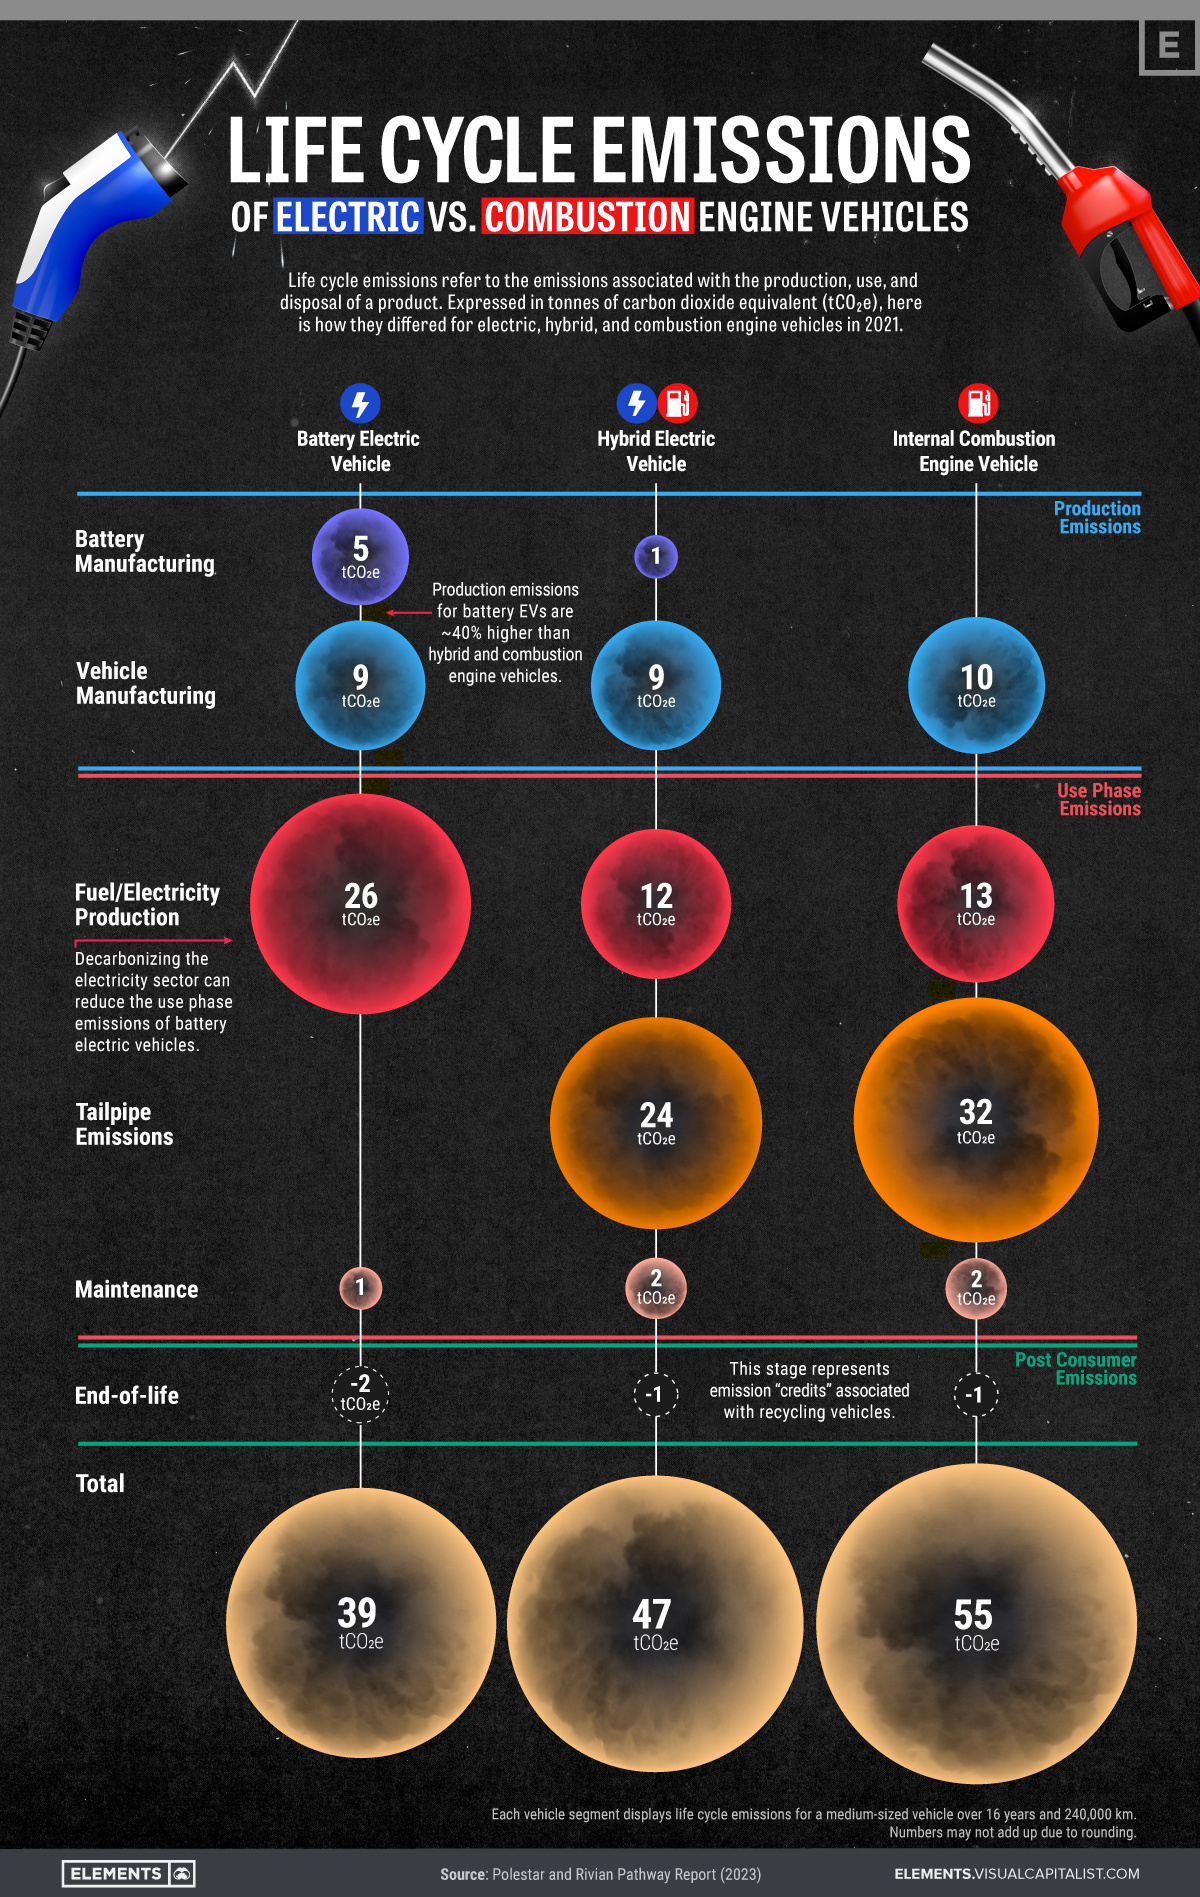
Here is an overview of the 2021 life cycle emissions of medium-sized electric, hybrid and ICE vehicles in each stage of their life cycles, using tCO2e. These numbers consider a use phase of 16 years and a distance of 240,000 km.
| Battery electric vehicle | Hybrid electric vehicle | Internal combustion engine vehicle | ||
|---|---|---|---|---|
| Production emissions (tCO2e) | Battery manufacturing | 5 | 1 | 0 |
| Vehicle manufacturing | 9 | 9 | 10 | |
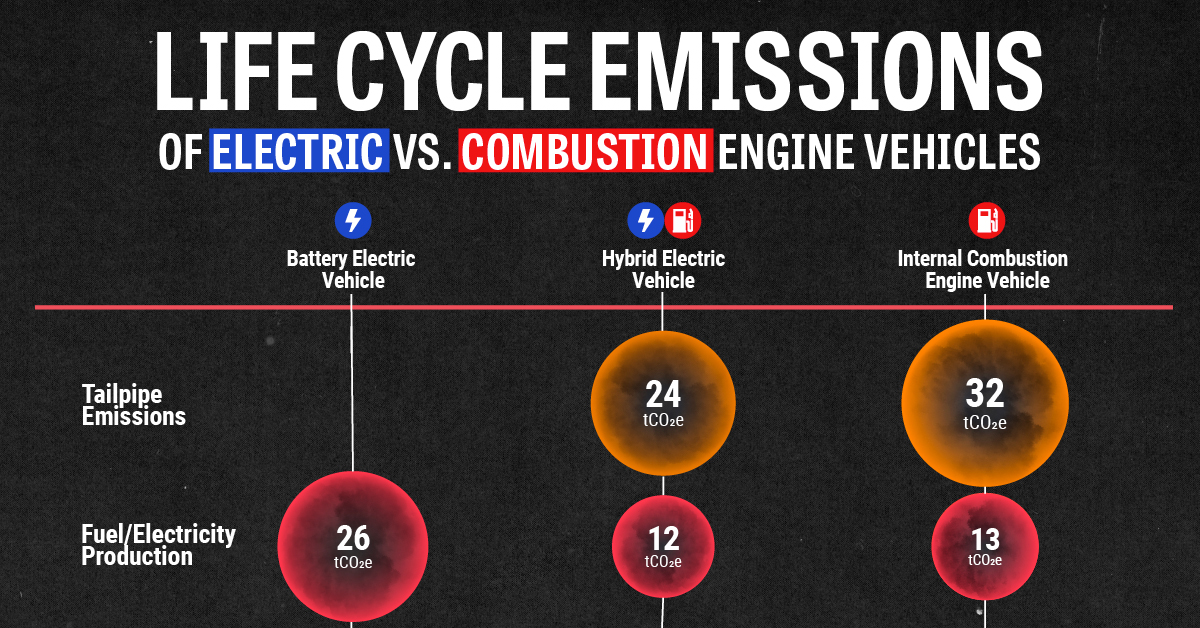
| Use phase emissions (tCO2e) | Fuel/electricity production | 26 | 12 | 13 |
| Tailpipe emissions | 0 | 24 | 32 | |
| Maintenance | 1 | 2 | 2 | |
| Post consumer emissions (tCO2e) | End-of-life | -2 | -1 | -1 |
| TOTAL | 39 tCO2e | 47 tCO2e | 55 tCO2e |
While it may not be surprising that battery electric vehicles (BEVs) have the lowest life cycle emissions of the three vehicle segments, we can also take some other insights from the data that may not be as obvious at first.
- The production emissions for BEVs are approximately 40% higher than those of hybrid and ICE vehicles. According to a McKinsey & Company study, this high emission intensity can be attributed to the extraction and refining of raw materials like lithium, cobalt, and nickel that are needed for batteries, as well as the energy-intensive manufacturing process of BEVs.
- Electricity production is by far the most emission-intensive stage in a BEVs life cycle. Decarbonizing the electricity sector by implementing renewable and nuclear energy sources can significantly reduce these vehicles’ use phase emissions.
- By recycling materials and components in their end-of-life stages, all vehicle segments can offset a portion of their earlier life cycle emissions.
Accelerating the Transition to Electric Mobility
As we move toward a carbon-neutral economy, battery electric vehicles can play an important role in reducing global CO2 emissions.
Despite their lack of tailpipe emissions, however, it’s good to note that many stages of a BEV’s life cycle are still quite emission-intensive, specifically when it comes to manufacturing and electricity production.
Advancing the sustainability of battery production and fostering the adoption of clean energy sources can, therefore, aid in lowering the emissions of BEVs even further, leading to increased environmental stewardship in the transportation sector.


Energy
Charted: 4 Reasons Why Lithium Could Be the Next Gold Rush
Visual Capitalist has partnered with EnergyX to show why drops in prices and growing demand may make now the right time to invest in lithium.


4 Reasons Why You Should Invest in Lithium
Lithium’s importance in powering EVs makes it a linchpin of the clean energy transition and one of the world’s most precious minerals.
In this graphic, Visual Capitalist partnered with EnergyX to explore why now may be the time to invest in lithium.
1. Lithium Prices Have Dropped
One of the most critical aspects of evaluating an investment is ensuring that the asset’s value is higher than its price would indicate. Lithium is integral to powering EVs, and, prices have fallen fast over the last year:
| Date | LiOH·H₂O* | Li₂CO₃** |
|---|---|---|
| Feb 2023 | $76 | $71 |
| March 2023 | $71 | $61 |
| Apr 2023 | $43 | $33 |
| May 2023 | $43 | $33 |
| June 2023 | $47 | $45 |
| July 2023 | $44 | $40 |
| Aug 2023 | $35 | $35 |
| Sept 2023 | $28 | $27 |
| Oct 2023 | $24 | $23 |
| Nov 2023 | $21 | $21 |
| Dec 2023 | $17 | $16 |
| Jan 2024 | $14 | $15 |
| Feb 2024 | $13 | $14 |
Note: Monthly spot prices were taken as close to the 14th of each month as possible.
*Lithium hydroxide monohydrate MB-LI-0033
**Lithium carbonate MB-LI-0029
2. Lithium-Ion Battery Prices Are Also Falling
The drop in lithium prices is just one reason to invest in the metal. Increasing economies of scale, coupled with low commodity prices, have caused the cost of lithium-ion batteries to drop significantly as well.
In fact, BNEF reports that between 2013 and 2023, the price of a Li-ion battery dropped by 82%.
| Year | Price per KWh |
|---|---|
| 2023 | $139 |
| 2022 | $161 |
| 2021 | $150 |
| 2020 | $160 |
| 2019 | $183 |
| 2018 | $211 |
| 2017 | $258 |
| 2016 | $345 |
| 2015 | $448 |
| 2014 | $692 |
| 2013 | $780 |

3. EV Adoption is Sustainable
One of the best reasons to invest in lithium is that EVs, one of the main drivers behind the demand for lithium, have reached a price point similar to that of traditional vehicle.
According to the Kelly Blue Book, Tesla’s average transaction price dropped by 25% between 2022 and 2023, bringing it in line with many other major manufacturers and showing that EVs are a realistic transport option from a consumer price perspective.
| Manufacturer | September 2022 | September 2023 |
|---|---|---|
| BMW | $69,000 | $72,000 |
| Ford | $54,000 | $56,000 |
| Volkswagon | $54,000 | $56,000 |
| General Motors | $52,000 | $53,000 |
| Tesla | $68,000 | $51,000 |
4. Electricity Demand in Transport is Growing
As EVs become an accessible transport option, there’s an investment opportunity in lithium. But possibly the best reason to invest in lithium is that the IEA reports global demand for the electricity in transport could grow dramatically by 2030:
| Transport Type | 2022 | 2025 | 2030 |
|---|---|---|---|
| Buses 🚌 | 23,000 GWh | 50,000 GWh | 130,000 GWh |
| Cars 🚙 | 65,000 GWh | 200,000 GWh | 570,000 GWh |
| Trucks 🛻 | 4,000 GWh | 15,000 GWh | 94,000 GWh |
| Vans 🚐 | 6,000 GWh | 16,000 GWh | 72,000 GWh |
The Lithium Investment Opportunity
Lithium presents a potentially classic investment opportunity. Lithium and battery prices have dropped significantly, and recently, EVs have reached a price point similar to other vehicles. By 2030, the demand for clean energy, especially in transport, will grow dramatically.
With prices dropping and demand skyrocketing, now is the time to invest in lithium.
EnergyX is poised to exploit lithium demand with cutting-edge lithium extraction technology capable of extracting 300% more lithium than current processes.

-

 Lithium5 days ago
Ranked: The Top 10 EV Battery Manufacturers in 2023
Asia dominates this ranking of the world’s largest EV battery manufacturers in 2023.
-

 Energy1 week ago
The World’s Biggest Nuclear Energy Producers
China has grown its nuclear capacity over the last decade, now ranking second on the list of top nuclear energy producers.
-

 Energy1 month ago
The World’s Biggest Oil Producers in 2023
Just three countries accounted for 40% of global oil production last year.
-

 Energy1 month ago
How Much Does the U.S. Depend on Russian Uranium?
Currently, Russia is the largest foreign supplier of nuclear power fuel to the U.S.
-

 Uranium2 months ago
Charted: Global Uranium Reserves, by Country
We visualize the distribution of the world’s uranium reserves by country, with 3 countries accounting for more than half of total reserves.
-

 Energy3 months ago
Visualizing the Rise of the U.S. as Top Crude Oil Producer
Over the last decade, the United States has established itself as the world’s top producer of crude oil, surpassing Saudi Arabia and Russia.


-

 Science1 week ago
Visualizing the Average Lifespans of Mammals
-

 Markets2 weeks ago
The Top 10 States by Real GDP Growth in 2023
-

 Demographics2 weeks ago
The Smallest Gender Wage Gaps in OECD Countries
-

 United States2 weeks ago
Where U.S. Inflation Hit the Hardest in March 2024
-

 Green2 weeks ago
Top Countries By Forest Growth Since 2001
-

 United States2 weeks ago
Ranked: The Largest U.S. Corporations by Number of Employees
-

 Maps2 weeks ago
The Largest Earthquakes in the New York Area (1970-2024)
-

 Green2 weeks ago
Ranked: The Countries With the Most Air Pollution in 2023