Green
Visualized: Per Capita Electricity Emissions, by State
Subscribe to the Decarbonization Channel’s free mailing list for more like this
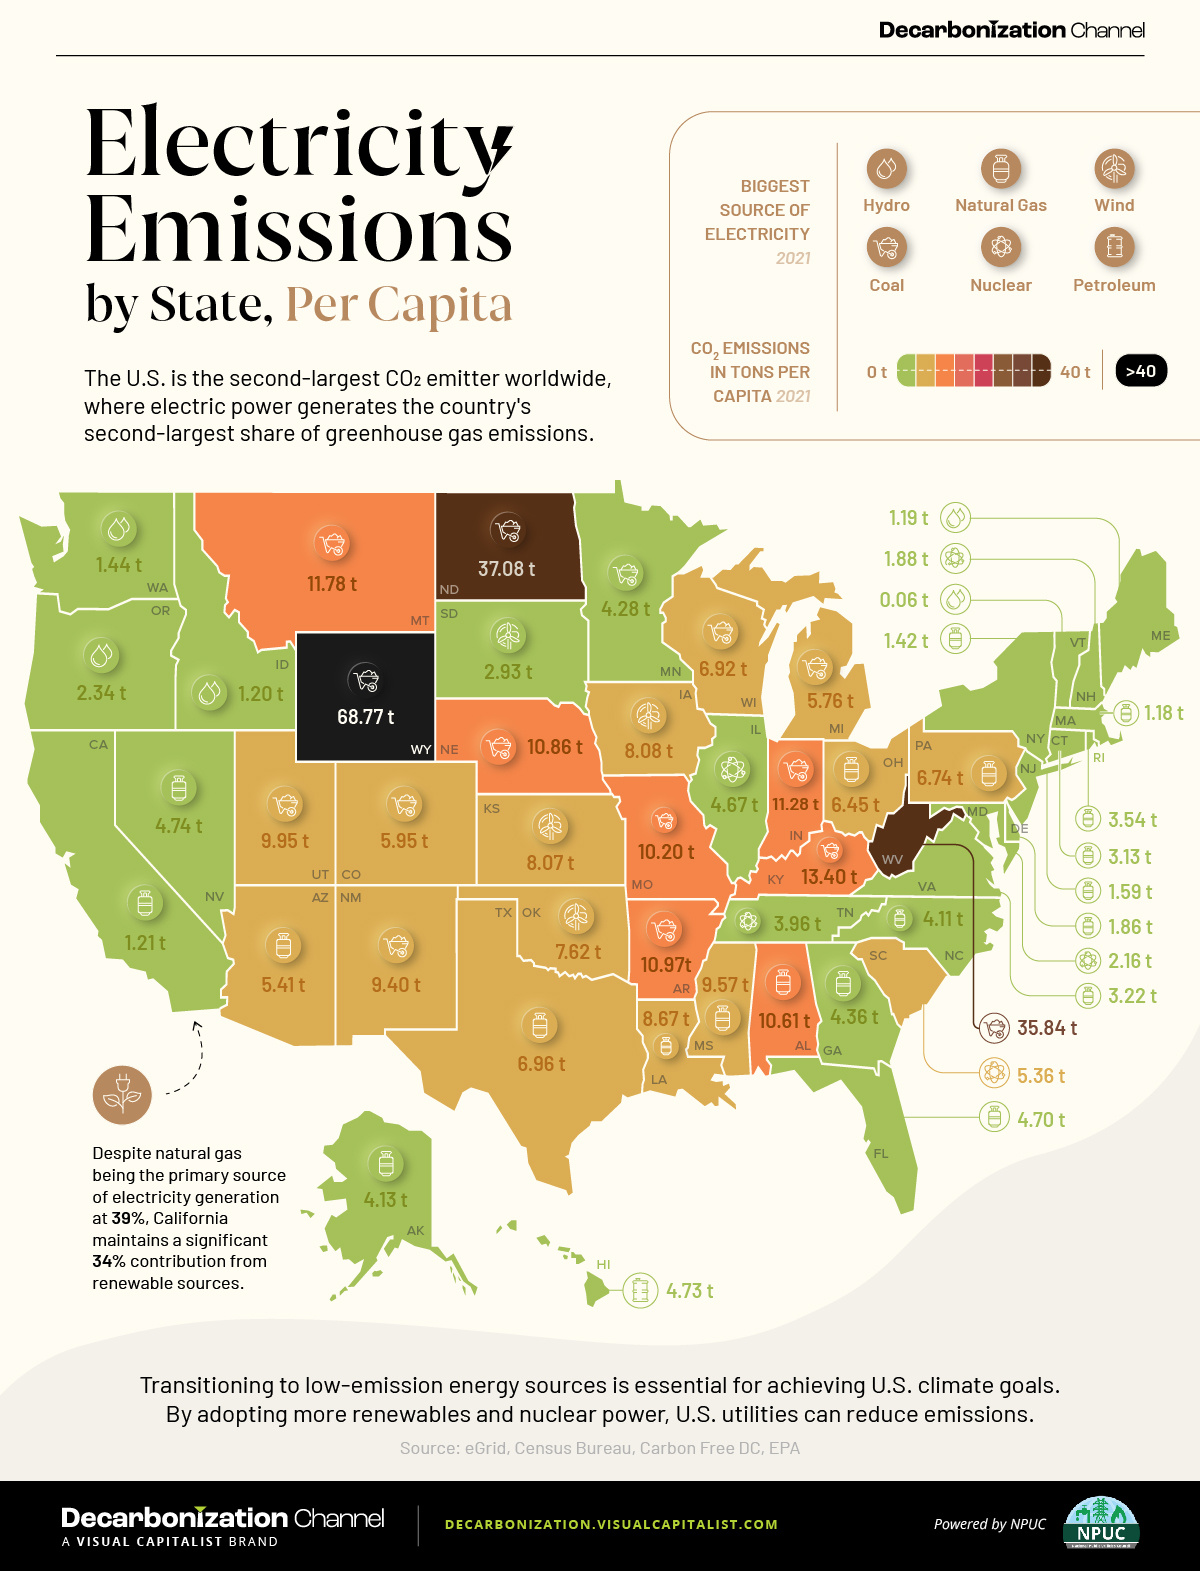
Per Capita Electricity Emissions by State
This was originally posted on the Decarbonization Channel. Subscribe to the free mailing list to be the first to see graphics related to decarbonization with a focus on the U.S. energy sector.
The U.S. is the second-largest CO₂ emitter worldwide, with electric power contributing significantly to the country’s greenhouse gas (GHG) emissions.
In collaboration with the National Public Utilities Council, this graphic uses data from eGrid to showcase per-capita electricity emissions by state and each state’s largest source of power.
U.S. Power Sector: Second in CO₂ Emissions
According to the Global Carbon Atlas, the top three global polluters are China, the U.S., and India—accounting for half of the world’s CO₂ emissions.
The U.S., however, leads by far in terms of CO₂ emissions per capita, with 15.3 metric tons per person, while China and India have lower rates at 7.4 and 1.9, respectively.
A substantial portion of these emissions comes from electricity generation. According to the United States Environmental Protection Agency, the electric power sector is the second-largest source of U.S. greenhouse gas emissions, contributing 25% to the total.
Examining emissions per state, Wyoming, North Dakota, and West Virginia top the list of CO₂ emissions per capita, relying primarily on coal as their source of energy.
Here is a table showing emissions by state per capita, from highest to lowest:
State CO2 emissions in tons per capita (2021) Biggest Source of Electricity (2021)
Wyoming 68.77 t Coal
North Dakota 37.08 t Coal
West Virginia 35.84 t Coal
Kentucky 13.40 t Coal
Montana 11.78 t Coal
Indiana 11.28 t Coal
Arkansas 10.97 t Coal
Nebraska 10.87 t Coal
Alabama 10.61 t Natural Gas
Missouri 10.20 t Coal
Utah 9.95 t Coal
Mississippi 9.57 t Natural Gas
New Mexico 9.40 t Coal
Louisiana 8.67 t Natural Gas
Iowa 8.08 t Wind
Kansas 8.07 t Wind
Oklahoma 7.62 t Wind
Texas 6.96 t Natural Gas
Wisconsin 6.92 t Coal
Pennsylvania 6.74 t Natural Gas
Ohio 6.45 t Natural Gas
Colorado 5.95 t Coal
Michigan 5.76 t Coal
Arizona 5.41 t Natural Gas
South Carolina 5.36 t Nuclear
Nevada 4.74 t Natural Gas
Hawaii 4.73 t Petroleum
Florida 4.70 t Natural Gas
Illinois 4.67 t Nuclear
Georgia 4.36 t Natural Gas
Minnesota 4.28 t Coal
Alaska 4.13 t Natural Gas
North Carolina 4.11 t Natural Gas
Tennessee 3.96 t Nuclear
Rhode Island 3.54 t Natural Gas
Virginia 3.22 t Natural Gas
Connecticut 3.13 t Natural Gas
South Dakota 2.93 t Wind
Oregon 2.34 t Hydro
Maryland 2.16 t Nuclear
New Hampshire 1.88 t Nuclear
Delaware 1.86 t Natural Gas
New Jersey 1.59 t Natural Gas
Washington 1.44 t Hydro
New York 1.42 t Natural Gas
California 1.21 t Natural Gas
Idaho 1.20 t Hydro
Maine 1.19 t Hydro
Massachusetts 1.18 t Natural Gas
District of Columbia 0.09 t Natural Gas
Vermont 0.06 t Hydro
Interestingly, from the top 10 on our list, only Alabama doesn’t have coal as the main source of electricity.
Conversely, four of the 10 states with the lowest CO₂ emissions per capita rely more heavily on renewables, especially hydropower.
Two of the largest consumers, California and Texas, have natural gas as their main source of electricity, but also maintain a significant share of renewable sources, with 34% and 44%, respectively.
Although coal accounted for 59% of CO₂ emissions from the energy sector, it represented only 23% of the electricity generated in the United States. Natural gas accounted for 37% of electricity generation in 2021.
The Transition to Low-Emission Sources
The U.S. has set a goal to reach 100% carbon pollution-free electricity by 2035.
Transitioning to low-emission energy sources like hydroelectricity, biomass, wind, and solar is essential for meeting U.S. climate goals.
In addition, clean energy stands out as the most significant job creator in America’s energy sector, with over 3 million Americans employed in clean energy jobs during 2021.


Green
The Carbon Footprint of Major Travel Methods
Going on a cruise ship and flying domestically are the most carbon-intensive travel methods.


The Carbon Footprint of Major Travel Methods
This was originally posted on our Voronoi app. Download the app for free on iOS or Android and discover incredible data-driven charts from a variety of trusted sources.
Did you know that transport accounts for nearly one-quarter of global energy-related carbon dioxide (CO₂) emissions?
This graphic illustrates the carbon footprints of major travel methods measured in grams of carbon dioxide equivalent (CO₂e) emitted per person to travel one kilometer. This includes both CO₂ and other greenhouse gases.
Data is sourced from Our World in Data, the UK Government’s Department for Energy Security and Net Zero, and The International Council on Clean Transportation, as of December 2022.
These figures should be interpreted as approximations, rather than exact numbers. There are many variables at play that determine the actual carbon footprint in any individual case, including vehicle type or model, occupancy, energy mix, and even weather.
Cruise Ships are the Most Carbon-Intensive Travel Method
According to these estimates, taking a cruise ship, flying domestically, and driving alone are some of the most carbon-intensive travel methods.
Cruise ships typically use heavy fuel oil, which is high in carbon content. The average cruise ship weighs between 70,000 to 180,000 metric tons, meaning they require large engines to get moving.
These massive vessels must also generate power for onboard amenities such as lighting, air conditioning, and entertainment systems.
Short-haul flights are also considered carbon-intensive due to the significant amount of fuel consumed during initial takeoff and climbing altitude, relative to a lower amount of cruising.
| Transportation method | CO₂ equivalent emissions per passenger km |
|---|---|
| Cruise Ship | 250 |
| Short-haul flight (i.e. within a U.S. state or European country) | 246 |
| Diesel car | 171 |
| Gas car | 170 |
| Medium-haul flight (i.e. international travel within Europe, or between U.S. states) | 151 |
| Long-haul flight (over 3,700 km, about the distance from LA to NY) | 147 |
| Motorbike | 113 |
| Bus (average) | 96 |
| Plug-in hybrid | 68 |
| Electric car | 47 |
| National rail | 35 |
| Tram | 28 |
| London Underground | 27 |
| Ferry (foot passenger) | 19 |
| Eurostar (International rail) | 4.5 |
Are EVs Greener?
Many experts agree that EVs produce a lower carbon footprint over time versus traditional internal combustion engine (ICE) vehicles.
However, the batteries in electric vehicles charge on the power that comes straight off the electrical grid—which in many places may be powered by fossil fuels. For that reason, the carbon footprint of an EV will depend largely on the blend of electricity sources used for charging.
There are also questions about how energy-intensive it is to build EVs compared to a comparable ICE vehicle.

-

 Science7 days ago
Visualizing the Average Lifespans of Mammals
-

 Markets2 weeks ago
The Top 10 States by Real GDP Growth in 2023
-

 Demographics2 weeks ago
The Smallest Gender Wage Gaps in OECD Countries
-

 United States2 weeks ago
Where U.S. Inflation Hit the Hardest in March 2024
-

 Green2 weeks ago
Top Countries By Forest Growth Since 2001
-

 United States2 weeks ago
Ranked: The Largest U.S. Corporations by Number of Employees
-

 Maps2 weeks ago
The Largest Earthquakes in the New York Area (1970-2024)
-

 Green2 weeks ago
Ranked: The Countries With the Most Air Pollution in 2023