Green
Visualizing All the World’s Carbon Emissions by Country

Visualizing All The World’s Carbon Emissions By Country
The greenhouse effect, essential for sustaining Earth’s life-friendly temperatures, has been intensified by burning fossil fuels.
This amplification of the natural greenhouse effect has led to significant alterations to the planet’s climate system.
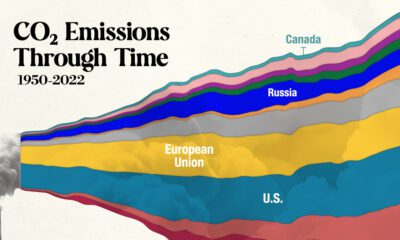
The graphic above uses data from the Global Carbon Atlas to explore which countries contribute the most to CO₂ emissions.
Ranked: Global CO₂ Emissions by Country
According to the Global Carbon Atlas, the world’s top polluters are China, India, and the U.S., which accounted for 52% of the world’s CO₂ in 2021.
These countries are also the biggest in terms of population.
| Rank | Country | Region | Total Emissions (%) |
|---|---|---|---|
| #1 | 🇨🇳 China | Asia | 30.9% |
| #2 | 🇺🇸 U.S. | North America | 13.5% |
| #3 | 🇮🇳 India | Asia | 7.3% |
| #4 | 🇷🇺 Russia | Europe | 4.7% |
| #5 | 🇯🇵 Japan | Asia | 2.9% |
| #6 | 🇮🇷 Iran | Asia | 2.0% |
| #7 | 🇩🇪 Germany | Europe | 1.8% |
| #8 | 🇸🇦 Saudi Arabia | Other | 1.8% |
| #9 | 🇮🇩 Indonesia | Asia | 1.7% |
| #10 | 🇰🇷 South Korea | Asia | 1.7% |
| #11 | 🇨🇦 Canada | North America | 1.5% |
| #12 | 🇧🇷 Brazil | South America | 1.3% |
| #13 | 🇹🇷 Türkiye | Europe | 1.2% |
| #14 | 🇿🇦 South Africa | Africa | 1.2% |
| #15 | 🇲🇽 Mexico | North America | 1.1% |
| #16 | 🇦🇺 Australia | Oceania | 1.1% |
| #17 | 🇬🇧 UK | Europe | 0.9% |
| #18 | 🇮🇹 Italy | Europe | 0.9% |
| #19 | 🇵🇱 Poland | Europe | 0.9% |
| n/a | 🌐 Rest of World | Other | 21.7% |
In terms of CO₂ emissions per capita (metric tons), the U.S. is relatively high at 15.32, while China and India rank lower at 7.44 and 1.89, respectively.
Historically, the U.S. has been the largest carbon emitter, releasing 422 billion metric tons of CO₂ into the atmosphere since the Industrial Revolution. This is equivalent to almost a quarter of all CO₂ produced from fossil fuels and industrial activities.
Given their massive populations and the fact that countries typically increase their emissions as they become more developed, China and India may continue to grow their shares even further. The International Energy Agency (IEA) forecasts that India’s share of global emissions could rise to 10% by 2030.
All of these major contributors of carbon to the atmosphere have set goals to reduce emissions over the next decades. While the U.S. targets net-zero emissions by 2050, China aims for carbon neutrality by 2060 and India recently set a target of 2070.


Green
How Carbon Credits Can Help Close the Climate Funding Gap
To keep a 1.5℃ world within reach, global emissions need to fall by as much as 45% by 2030, and carbon credits could help close the gap.


How Carbon Credits Can Help Close the Climate Funding Gap
Governments around the world have committed to the goals of the Paris Agreement, but their climate pledges are insufficient. To keep a 1.5℃ world within reach, global emissions need to fall by as much as 45% by 2030.
Bold and immediate action is essential, but so are resources that will make it happen.
In this graphic, we have partnered with Carbon Streaming to look at the role that the voluntary carbon market and carbon credits can play in closing that gap.
More Funds are Needed for Climate Finance
According to data from the Climate Policy Initiative, climate finance, which includes funds for both adaptation and mitigation, needs to increase at least five-fold, from $1.3T in 2021/2022, to an average $8.6T annually until 2030, and then to just over $10T in the two decades leading up to 2050.
That adds up to a very large number, but consider that in 2022, $7.0T went to fossil fuel subsidies, which almost covers the annual estimated outlay. And the world has shown that when pressed, governments can come up with the money, if the global pandemic is any indication.
Mobilizing Carbon Finance to the Developing World
But the same cannot be said of the developing world, where debt, inequality, and poverty reduce the ability of governments to act. And this is where carbon credits can play an important role. According to analyses from Ecosystem Marketplace, carbon credits help move capital from developed countries, to where funds are needed in the developing world.
For example, in 2019, 69.2% of the carbon credits by volume in the voluntary carbon market were purchased by buyers in Europe, and nearly a third from North America. Compare that to over 90% of the volume of carbon credits sold in the voluntary carbon market in 2022 came from projects that were located outside of those two regions.
Carbon Credits Can Complement Decarbonization Efforts
Carbon credits can also complement decarbonization efforts in the corporate world, where more and more companies have been signing up to reduce emissions. According to the 2022 monitoring report from the Science Based Targets initiative, 4,230 companies around the world had approved targets and commitments, which represented an 88% increase from the prior year. However, as of year end 2022, combined scope 1 and 2 emissions covered by science-based targets totaled approximately 2 GtCO2e, which represents just a fraction of global emissions.
The fine print is that this is just scope 1 and 2 emissions, and doesn’t include scope 3 emissions, which can account for more than 70% of a company’s total emissions. And as these emissions come under greater and greater scrutiny the closer we get to 2030 and beyond, the voluntary carbon credit market could expand exponentially to help meet the need to compensate for these emissions.
Potential Carbon Credit Market Size in 2030
OK, but how big? In 2022, the voluntary carbon credit market was around $2B, but some analysts predict that it could grow to between $5–250 billion by 2030.
| Firm | Low Estimate | High Estimate |
|---|---|---|
| Bain & Company | $15B | $30B |
| Barclays | N/A | $250B |
| Citigroup | $5B | $50B |
| McKinsey & Company | $5B | $50B |
| Morgan Stanley | N/A | $100B |
| Shell / Boston Consulting Group | $10B | $40B |
Morgan Stanley and Barclays were the most bullish on the size of the voluntary carbon credit market in 2030, but the latter firm was even more optimistic about 2050, and predicted that the voluntary carbon credit market could grow to a colossal $1.5 trillion.
Carbon Streaming is Focused on Carbon Credit Integrity
Ultimately, carbon credits could have an important role to play in marshaling the resources needed to keep the world on track to net zero by 2050, and avoiding the worst consequences of a warming world.
Carbon Streaming uses streaming transactions, a proven and flexible funding model, to scale high-integrity carbon credit projects to advance global climate action and UN Sustainable Development Goals.
Learn more at www.carbonstreaming.com.

-

 Green1 week ago
Ranking the Top 15 Countries by Carbon Tax Revenue
This graphic highlights France and Canada as the global leaders when it comes to generating carbon tax revenue.
-

 Green2 weeks ago
Ranked: The Countries With the Most Air Pollution in 2023
South Asian nations are the global hotspot for pollution. In this graphic, we rank the world’s most polluted countries according to IQAir.
-

 Environment2 weeks ago
Top Countries By Forest Growth Since 2001
One country is taking reforestation very seriously, registering more than 400,000 square km of forest growth in two decades.
-

 Green3 weeks ago
Ranked: Top Countries by Total Forest Loss Since 2001
The country with the most forest loss since 2001 lost as much forest cover as the next four countries combined.
-

 Markets2 months ago
The World’s Top Cocoa Producing Countries
Here are the largest cocoa producing countries globally—from Côte d’Ivoire to Brazil—as cocoa prices hit record highs.
-

 Environment2 months ago
Charted: Share of World Forests by Country
We visualize which countries have the biggest share of world forests by area—and while country size plays a factor, so too, does the environment.


-

 Education1 week ago
How Hard Is It to Get Into an Ivy League School?
-

 Technology2 weeks ago
Ranked: Semiconductor Companies by Industry Revenue Share
-

 Markets2 weeks ago
Ranked: The World’s Top Flight Routes, by Revenue
-

 Demographics2 weeks ago
Population Projections: The World’s 6 Largest Countries in 2075
-

 Markets2 weeks ago
The Top 10 States by Real GDP Growth in 2023
-

 Demographics2 weeks ago
The Smallest Gender Wage Gaps in OECD Countries
-

 Economy2 weeks ago
Where U.S. Inflation Hit the Hardest in March 2024
-
Environment2 weeks ago
Top Countries By Forest Growth Since 2001