

South Asian nations are the global hotspot for pollution. In this graphic, we rank the world’s most polluted countries according to IQAir.
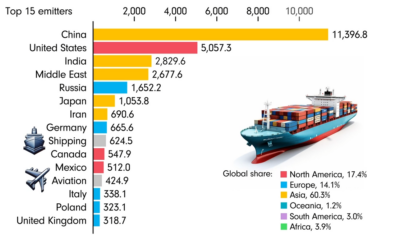

This animated chart by James Eagle uses data from Our World in Data to show the 15 largest carbon emitters between 1850 and 2022.
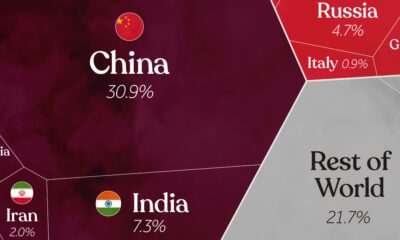

China, India, and the U.S. together account for roughly half of the world's CO₂. This visual breaks down all carbon emissions by country.
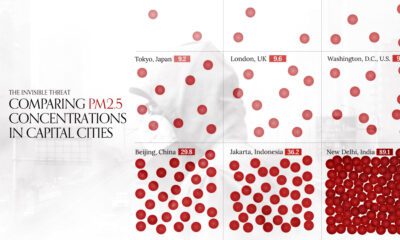

This visual compares air quality in 50 capital cities around the world by average PM2.5 concentrations in 2022.
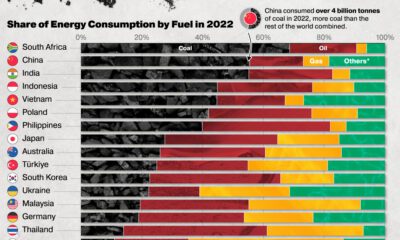

Global consumption of coal surpassed 8 billion tonnes per year for the first time in 2022. Here are the countries using the most coal.
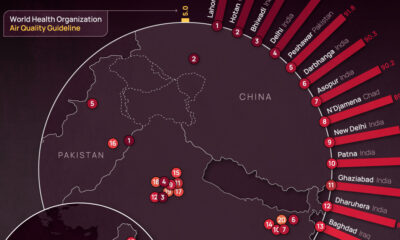

Using 2022 average PM2.5 concentrations, we've ranked the most polluted cities in the world according to IQAir.
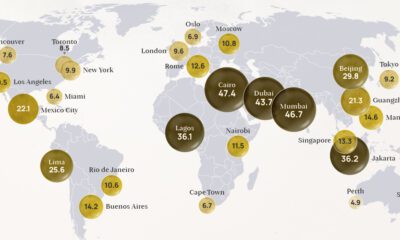

Exploring 2022 average air pollution levels around the world by PM2.5 concentration.
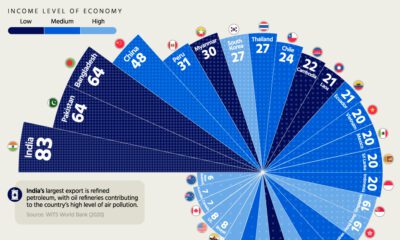

Which economies have hazy air, and which ones enjoy mostly clear skies? Find out in this geographic breakdown of air pollution levels.
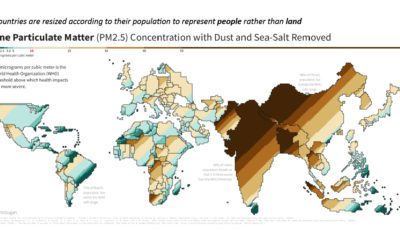

This population-weighted cartogram shows the countries with the worst air pollution, based on fine particulate matter (PM2.5) concentration.