Green
Ranked: The Foods With the Largest Environmental Impact


The Environmental Impacts of Food Production
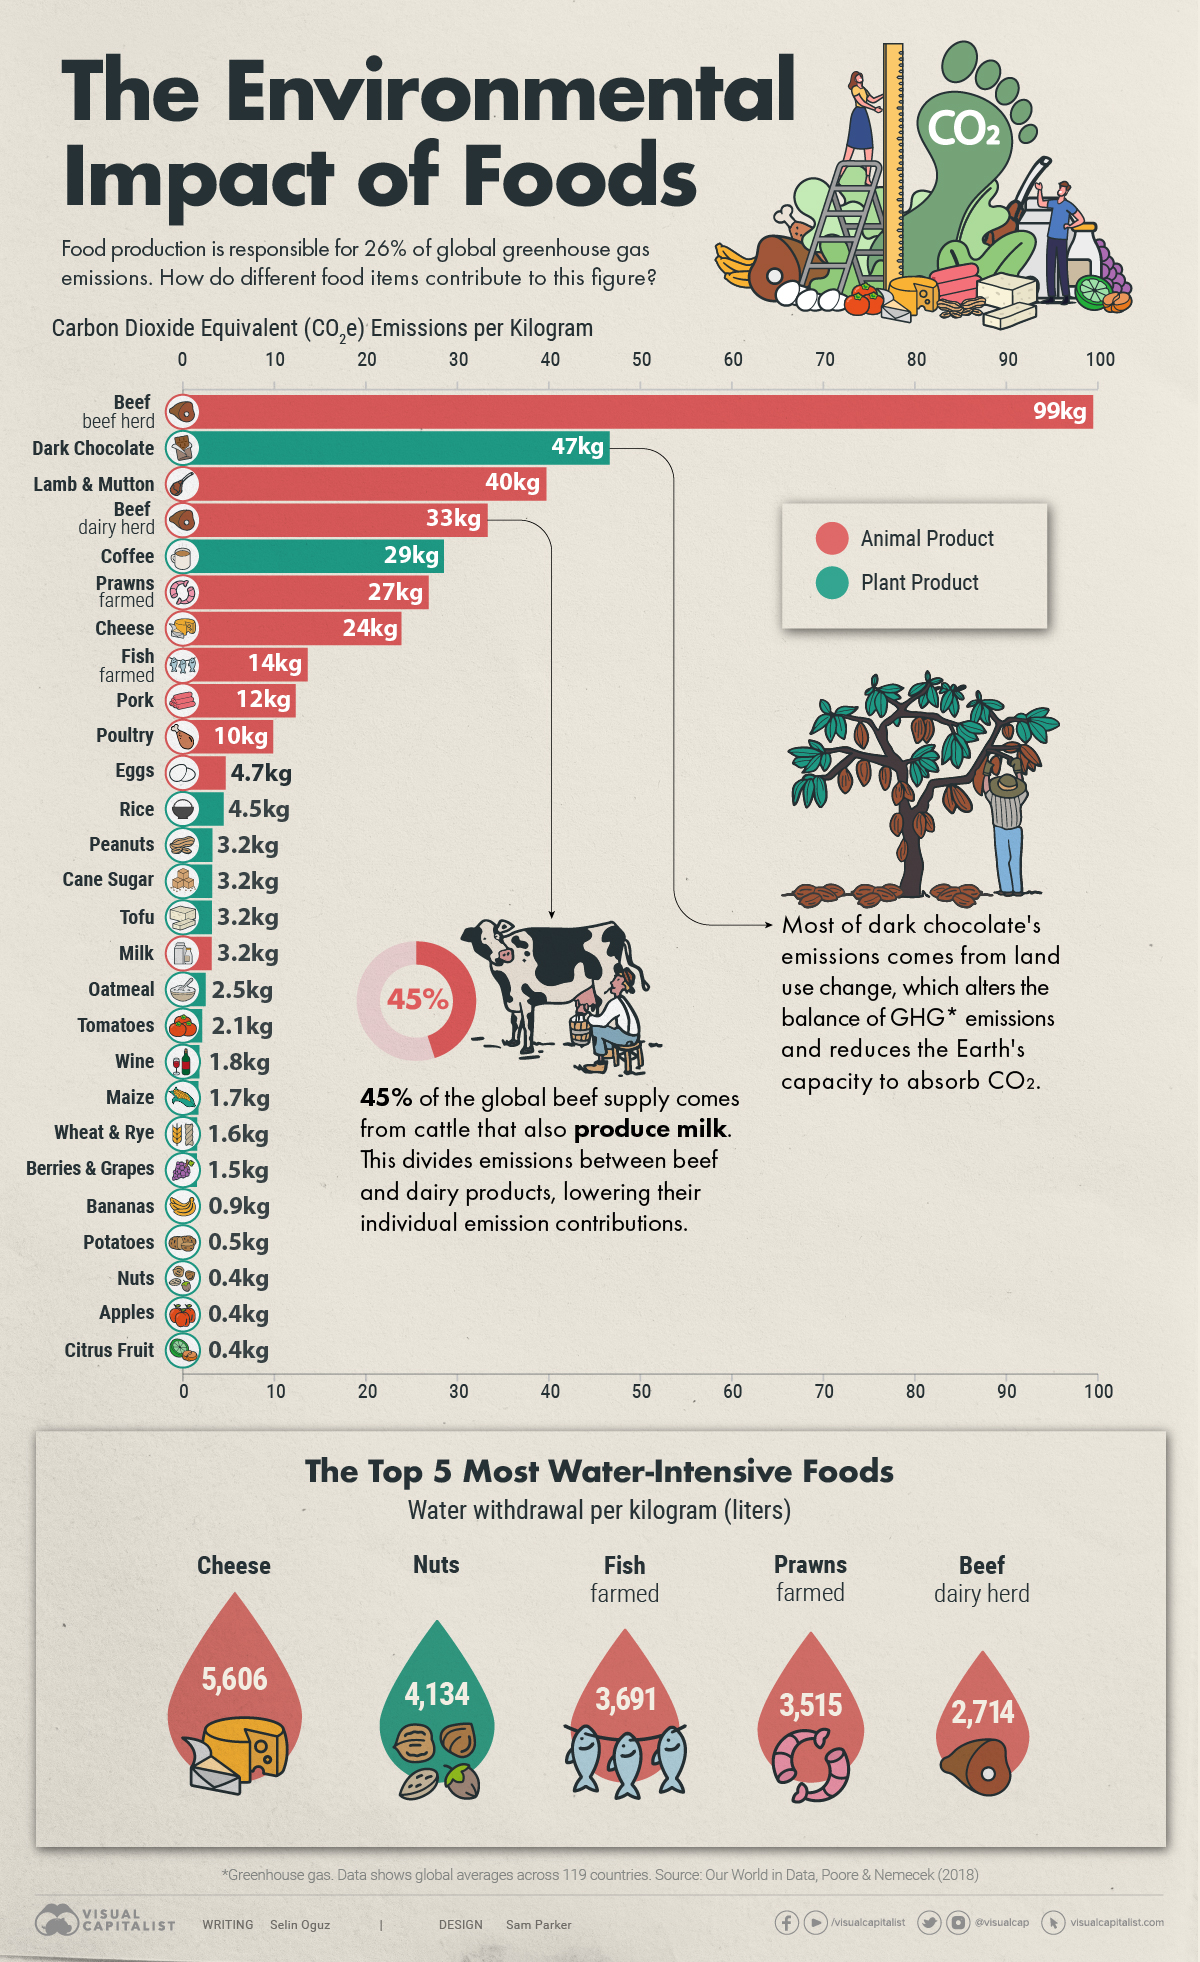
Food and agriculture have a significant impact on our planet, particularly in terms of carbon emissions, water withdrawals, and land use.
To visualize how different food items contribute to this environmental impact, the above graphic ranks foods based on their greenhouse gas (GHG) emissions and water withdrawals, using data from Poore and Nemecek and Our World in Data.
The Carbon Giants
Based on carbon dioxide equivalent (CO2e) measurements, beef comes in first place as the food with the largest carbon footprint, emitting an astounding 99 kilograms of CO2e per kilogram of the final meat product.
CO2e emissions are a standardized measure that express the warming impact of various greenhouse gases—such as methane and nitrous oxide—in terms of the amount of CO2 that would have the same warming effect.
The production of beef is extremely resource-intensive, demanding substantial land, water, and energy resources. Cows also produce methane during their digestive processes, a gas that has a warming potential 27–30 times higher than that of CO2 over a 100-year time period.
| Food item | CO2e emissions per kilogram |
|---|---|
| Beef (beef herd) | 99.48 kg |
| Dark Chocolate | 46.65 kg |
| Lamb & Mutton | 39.72 kg |
| Beef (dairy herd) | 33.30 kg |
| Coffee | 28.53 kg |
| Prawns (farmed) | 26.87 kg |
| Cheese | 23.88 kg |
| Fish (farmed) | 13.63 kg |
| Pork | 12.31 kg |
| Poultry | 9.87 kg |
| Eggs | 4.67 kg |
| Rice | 4.45 kg |
| Peanuts | 3.23 kg |
| Cane Sugar | 3.20 kg |
| Tofu | 3.16 kg |
| Milk | 3.15 kg |
| Oatmeal | 2.48 kg |
| Tomatoes | 2.09 kg |
| Wine | 1.79 kg |
| Maize | 1.70 kg |
| Wheat & Rye | 1.57 kg |
| Berries & Grapes | 1.53 kg |
| Bananas | 0.86 kg |
| Potatoes | 0.46 kg |
| Apples | 0.43 kg |
| Nuts | 0.43 kg |
| Root Vegetables | 0.43 kg |
| Citrus Fruit | 0.39 kg |
Following beef on the list is dark chocolate, albeit not very closely.
Most of dark chocolate’s emissions come from land use changes—such as deforestation— which alters the balance of GHG emissions and reduces the Earth’s capacity to absorb CO2.
All in all, however, the data shows us that animal products are generally more emission-intensive than plant-based foods.
Water Use in Food Production
The Food and Agriculture Organization (FAO) states that more than two-thirds of the world’s freshwater withdrawals are used for food production.
Interestingly, the trend that we saw when considering the carbon footprints of foods also applies when it comes to water use. Among the top 10 most water-intensive foods in the world, 70% are of animal origin, highlighting that animal products aren’t only more carbon-intensive but also more water-intensive than plant products.
| Food item | Water withdrawal per kilogram |
|---|---|
| Cheese | 5,605 liters |
| Nuts | 4,134 liters |
| Fish (farmed) | 3,691 liters |
| Prawns (farmed) | 3,515 liters |
| Beef (dairy herd) | 2,714 liters |
| Rice | 2,248 liters |
| Peanuts | 1,852 liters |
| Lamb & Mutton | 1,803 liters |
| Pork | 1,796 liters |
| Beef (beef herd) | 1,451 liters |
Peanuts, rice, and nuts (which include hard-shelled fruits such as hazelnuts, chestnuts, and walnuts) make up the plant-based outliers in the list.
Making More Sustainable Food Choices
Eating locally sourced foods is often posed as a solution for lowering our ecological impact, leading to the growing popularity of concepts such as “The 100 Mile Diet.”
An analysis done by Our World in Data, however, shows us that what we eat makes more of a difference in lowering our environmental footprints than where our food comes from.
More specifically, the data highlights that transportation accounts for just 5% of global food emissions. Land use change and farming activities, on the other hand, account for a much more significant portion.
As such, redirecting our attention from the distance food travels to the emissions associated with its production can yield better outcomes in our efforts to make more sustainable food choices.


Green
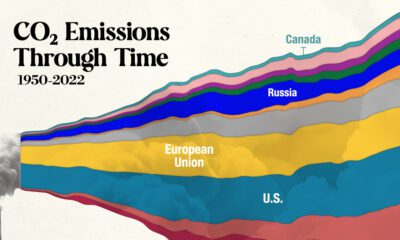
The Carbon Footprint of Major Travel Methods
Going on a cruise ship and flying domestically are the most carbon-intensive travel methods.


The Carbon Footprint of Major Travel Methods
This was originally posted on our Voronoi app. Download the app for free on iOS or Android and discover incredible data-driven charts from a variety of trusted sources.
Did you know that transport accounts for nearly one-quarter of global energy-related carbon dioxide (CO₂) emissions?
This graphic illustrates the carbon footprints of major travel methods measured in grams of carbon dioxide equivalent (CO₂e) emitted per person to travel one kilometer. This includes both CO₂ and other greenhouse gases.
Data is sourced from Our World in Data, the UK Government’s Department for Energy Security and Net Zero, and The International Council on Clean Transportation, as of December 2022.
These figures should be interpreted as approximations, rather than exact numbers. There are many variables at play that determine the actual carbon footprint in any individual case, including vehicle type or model, occupancy, energy mix, and even weather.
Cruise Ships are the Most Carbon-Intensive Travel Method
According to these estimates, taking a cruise ship, flying domestically, and driving alone are some of the most carbon-intensive travel methods.
Cruise ships typically use heavy fuel oil, which is high in carbon content. The average cruise ship weighs between 70,000 to 180,000 metric tons, meaning they require large engines to get moving.
These massive vessels must also generate power for onboard amenities such as lighting, air conditioning, and entertainment systems.
Short-haul flights are also considered carbon-intensive due to the significant amount of fuel consumed during initial takeoff and climbing altitude, relative to a lower amount of cruising.
| Transportation method | CO₂ equivalent emissions per passenger km |
|---|---|
| Cruise Ship | 250 |
| Short-haul flight (i.e. within a U.S. state or European country) | 246 |
| Diesel car | 171 |
| Gas car | 170 |
| Medium-haul flight (i.e. international travel within Europe, or between U.S. states) | 151 |
| Long-haul flight (over 3,700 km, about the distance from LA to NY) | 147 |
| Motorbike | 113 |
| Bus (average) | 96 |
| Plug-in hybrid | 68 |
| Electric car | 47 |
| National rail | 35 |
| Tram | 28 |
| London Underground | 27 |
| Ferry (foot passenger) | 19 |
| Eurostar (International rail) | 4.5 |
Are EVs Greener?
Many experts agree that EVs produce a lower carbon footprint over time versus traditional internal combustion engine (ICE) vehicles.
However, the batteries in electric vehicles charge on the power that comes straight off the electrical grid—which in many places may be powered by fossil fuels. For that reason, the carbon footprint of an EV will depend largely on the blend of electricity sources used for charging.
There are also questions about how energy-intensive it is to build EVs compared to a comparable ICE vehicle.

-

 Education1 week ago
How Hard Is It to Get Into an Ivy League School?
-

 Technology2 weeks ago
Ranked: Semiconductor Companies by Industry Revenue Share
-

 Markets2 weeks ago
Ranked: The World’s Top Flight Routes, by Revenue
-

 Demographics2 weeks ago
Population Projections: The World’s 6 Largest Countries in 2075
-

 Markets2 weeks ago
The Top 10 States by Real GDP Growth in 2023
-

 Demographics2 weeks ago
The Smallest Gender Wage Gaps in OECD Countries
-

 Economy2 weeks ago
Where U.S. Inflation Hit the Hardest in March 2024
-

 Green2 weeks ago
Top Countries By Forest Growth Since 2001