Green
Ranked: The Most Carbon-Intensive Sectors in the World
![]() Subscribe to the Elements free mailing list for more like this
Subscribe to the Elements free mailing list for more like this
Ranked: The Most Carbon-Intensive Sectors in the World
This was originally posted on Elements. Sign up to the free mailing list to get beautiful visualizations on real assets and resource megatrends each week.
Ever wonder which sectors contribute the most to CO2 emissions around the world?
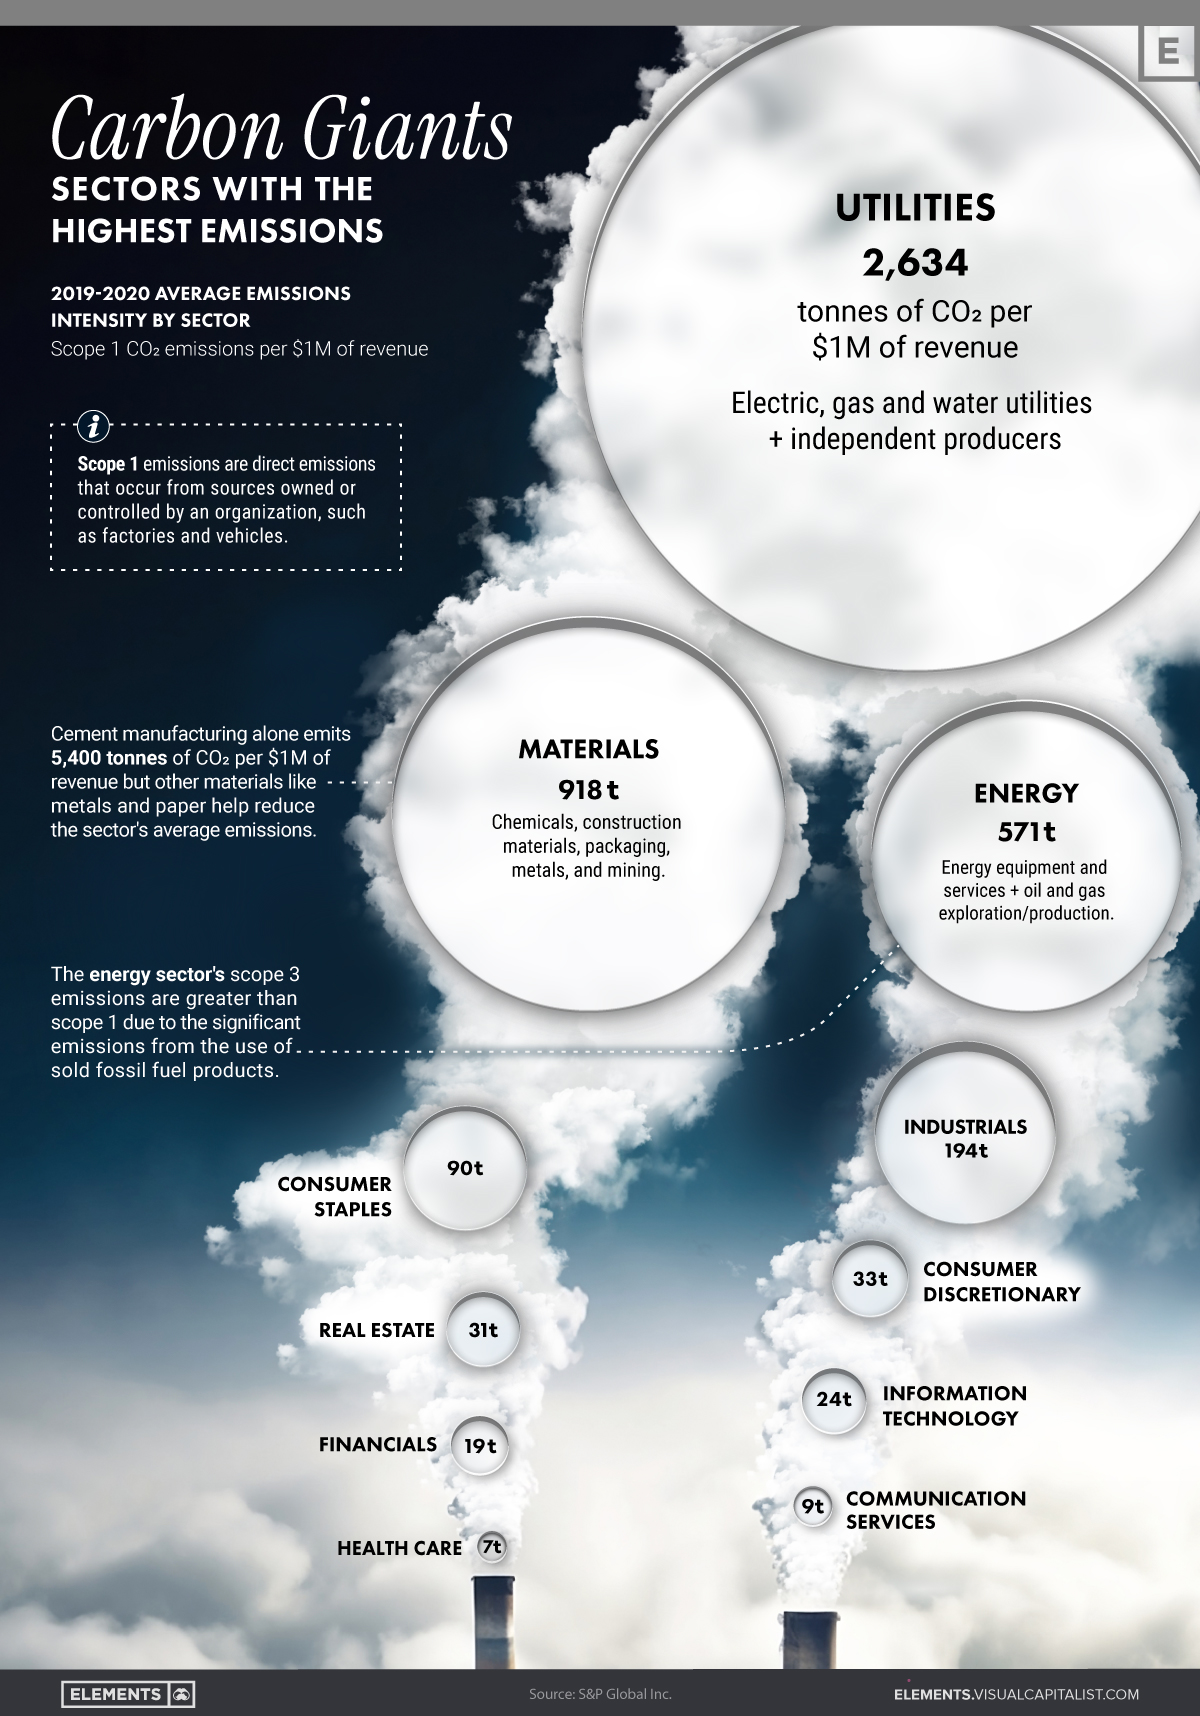
In this graphic, we explore the answers to that question by comparing average Scope 1 emission intensities by sector, according to an analysis done by S&P Global Inc.
Defining Scope 1 Emissions
Before diving into the data, it may be useful to understand what Scope 1 emissions entail.
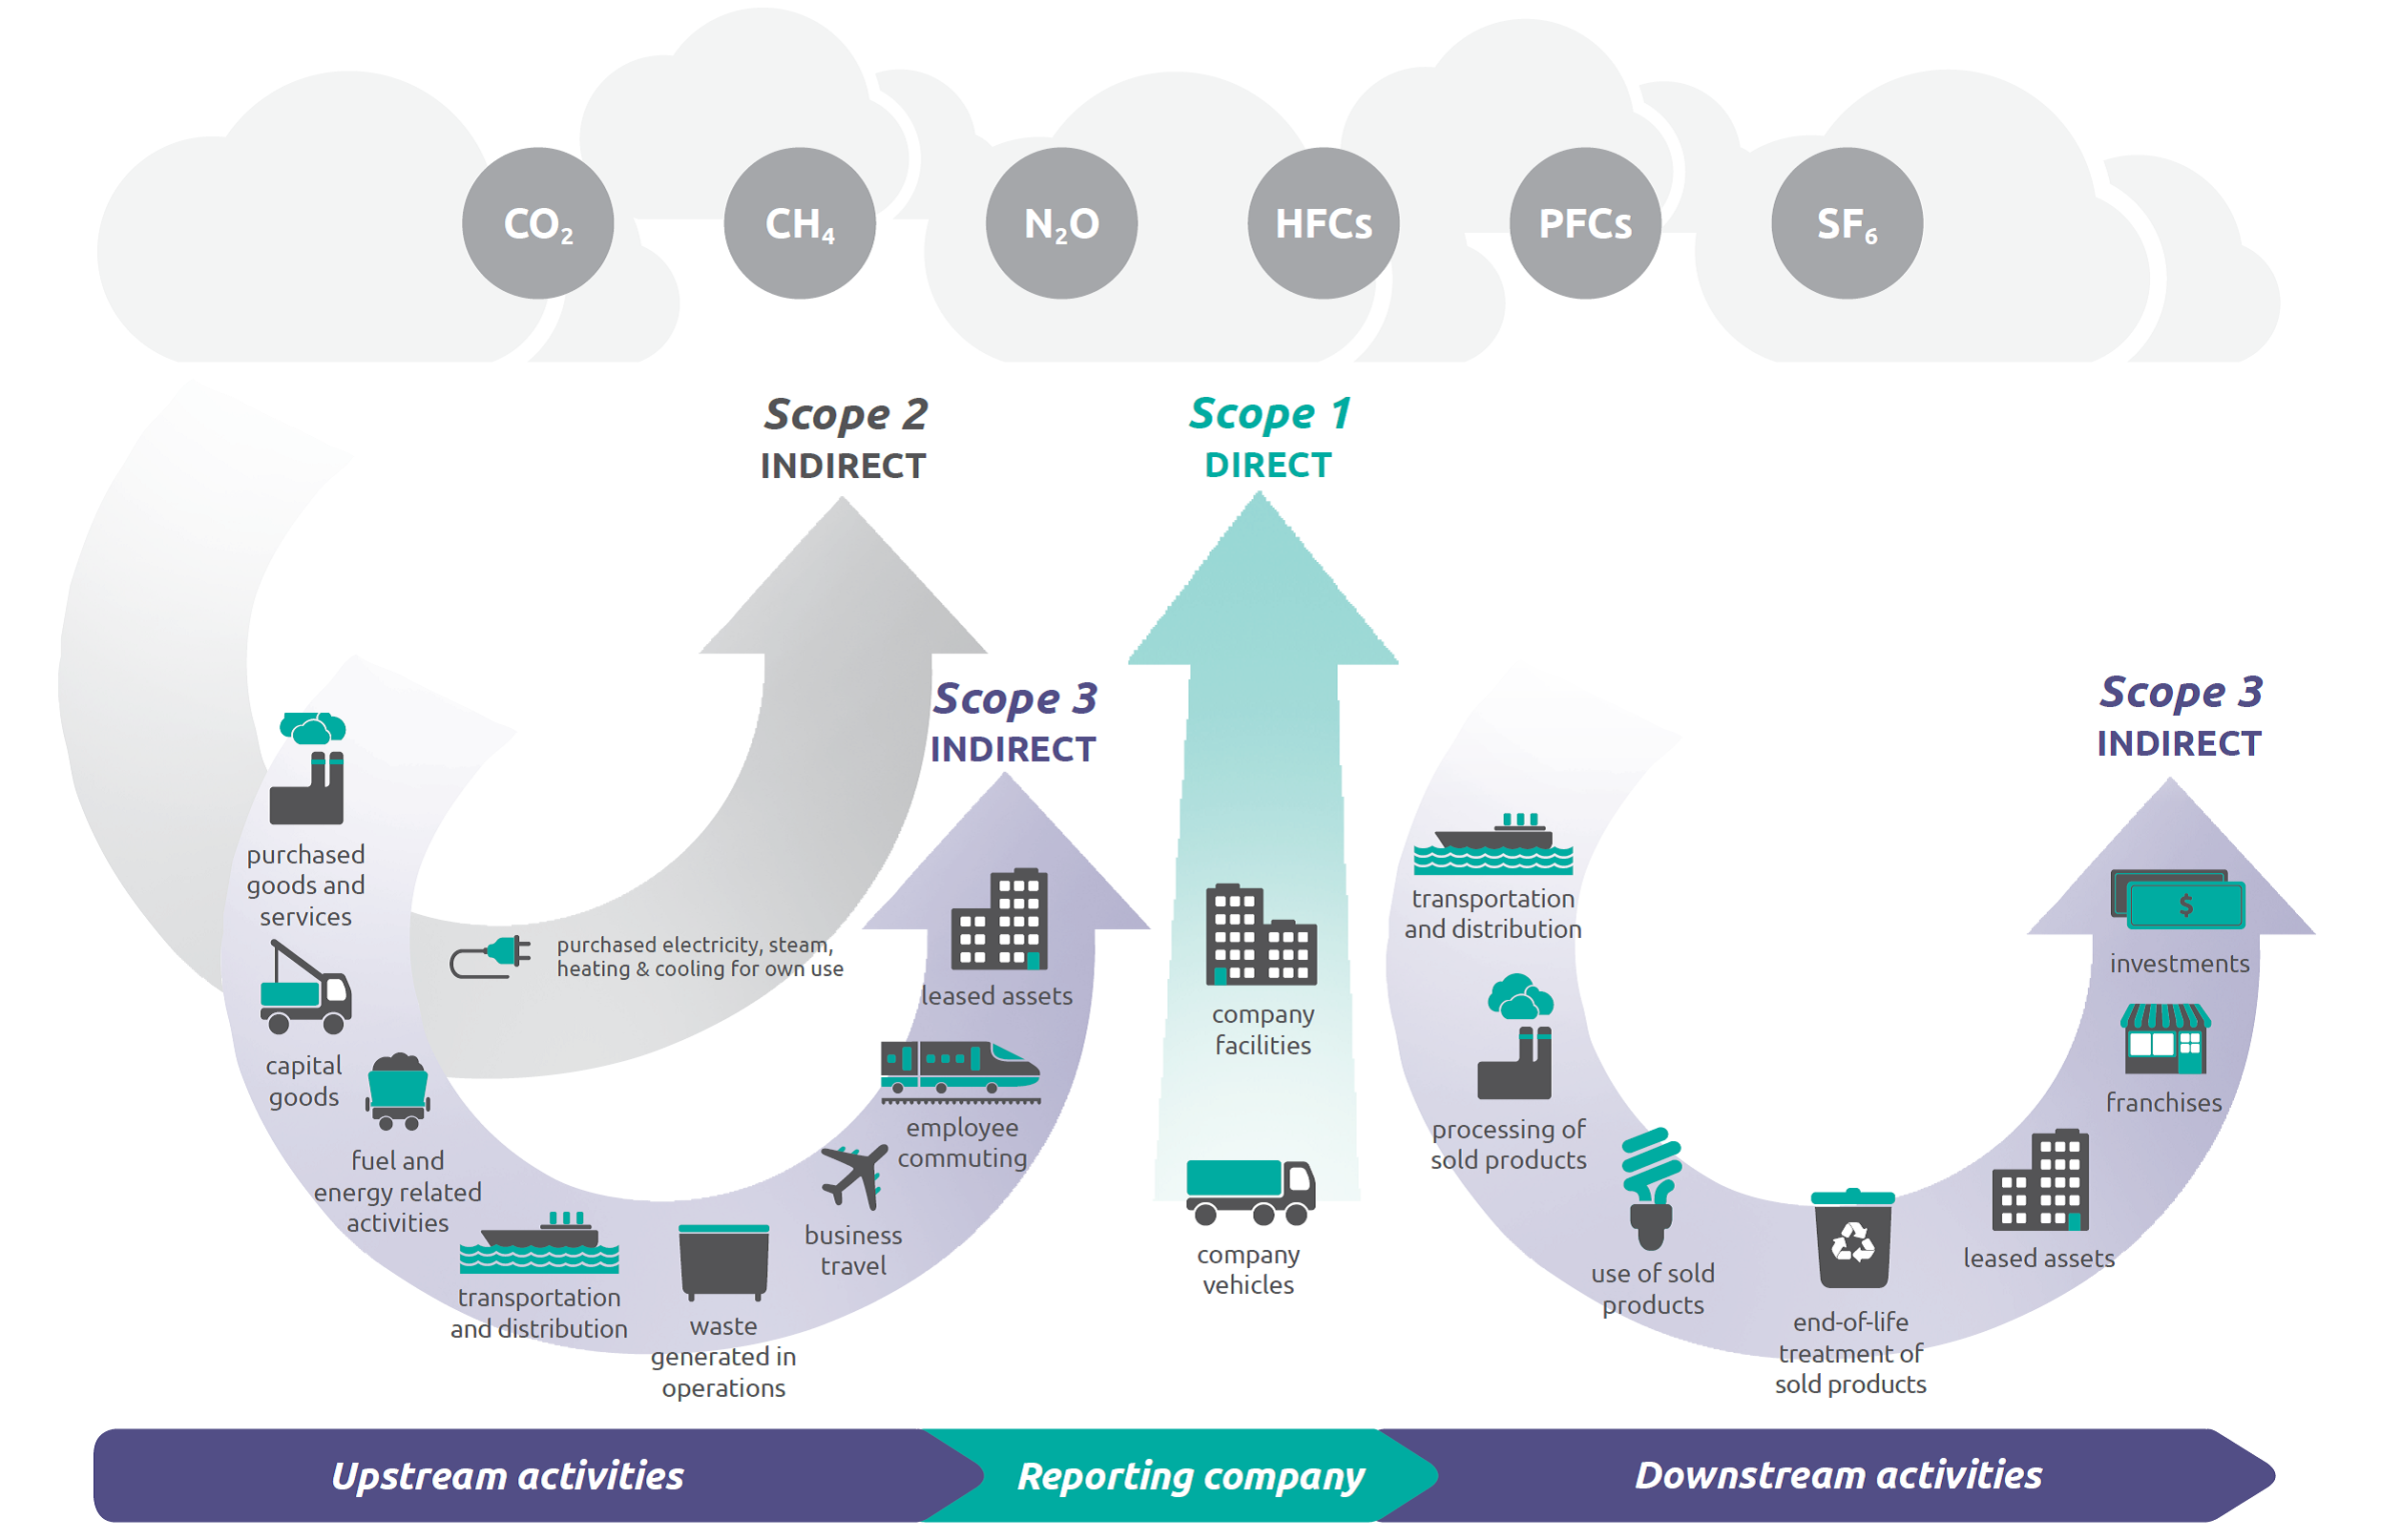
Scope 1 emissions are direct greenhouse gas emissions from sources that are owned or controlled by a company, such as their facilities and vehicles.
Source: U.S. Environmental Protection Agency
Scope 1 emissions can do a good job of highlighting a company’s environmental footprint because they represent the direct emissions related to manufacturing or creating a company’s products, whether they are tangible goods, digital software, or services.
Scope 2 and 3 emissions, on the other hand, encompass the indirect emissions associated with a company’s activities, including those from a company’s purchased electricity, leased assets, or investments.
Ranking the Carbon Giants
According to S&P Global’s analysis of 2019-2020 average emissions intensity by sector, utilities is the most carbon-intensive sector in the world, emitting a staggering 2,634 tonnes of CO2 per $1 million of revenue.
Materials and energy sectors follow behind, with 918 tonnes and 571 tonnes of CO2 emitted, respectively.
| Sector | Sector Explanation | Scope 1 CO2 emissions per $1M of revenue, 2019-2020 |
|---|---|---|
| Utilities | Electric, gas, and water utilities and independent producers | 2,634 tonnes |
| Materials | Chemicals, construction materials, packaging, metals, and mining | 918 tonnes |
| Energy | Oil and gas exploration/production and energy equipment | 571 tonnes |
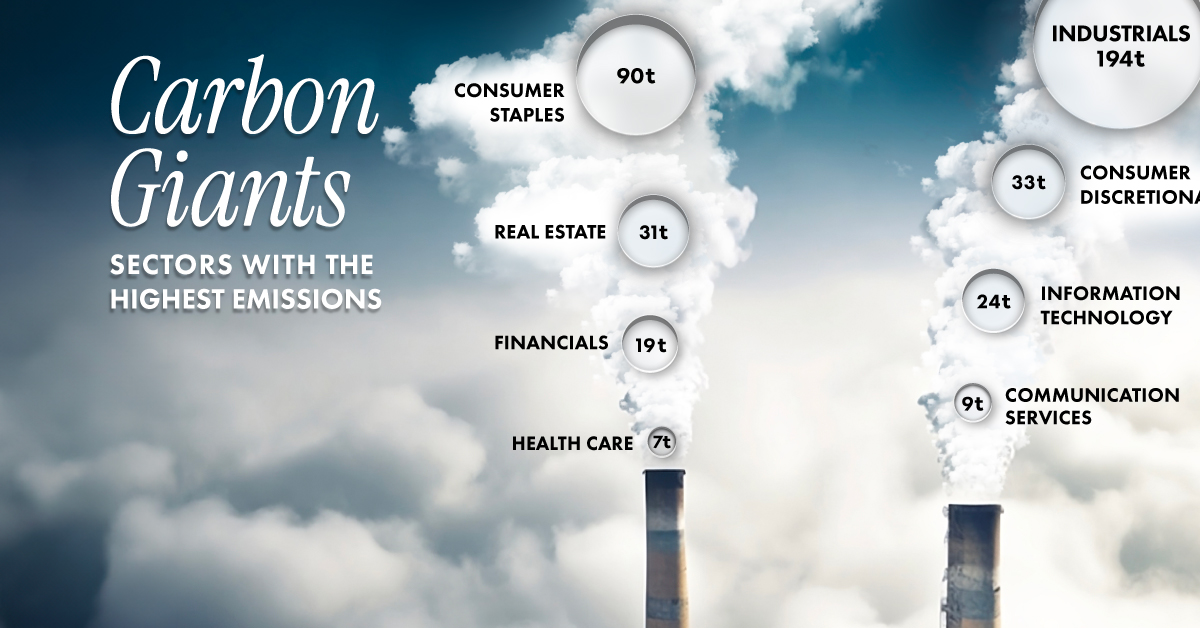
| Industrials | Capital goods, commercial services, and transportation | 194 tonnes |
| Consumer staples | Food, household goods, and personal products | 90 tonnes |
| Consumer discretionary | Automobiles, consumer durables, apparel, and retailing | 33 tonnes |
| Real estate | Real estate and real estate management | 31 tonnes |
| Information technology | Software, technology hardware, and semiconductors | 24 tonnes |
| Financials | Banks, insurance, and diversified financials | 19 tonnes |
| Communication services | Telecommunication, media, and entertainment | 9 tonnes |
| Health care | Health care equipment, pharmaceuticals, biotechnology, and life sciences | 7 tonnes |
S&P Global also reveals some interesting insights when it comes to various industries within the materials sector, including:
- Cement manufacturing exhibits an extremely high level of Scope 1 emissions, emitting more than double the emissions from the utilities sector (5,415 tonnes of CO2 per $1M of revenue)
- Aluminum and steel production are also quite emission-intensive, emitting 1,421 and 1,390 tonnes respectively in 2019-2020
- Relatively lower-emission materials such as gold, glass, metals and paper products bring down the average emissions of the materials sector
Given these trends, a closer look at emission-intensive industries and sectors is necessary for our urgent need to decarbonize the global economy.


Green
The Carbon Footprint of Major Travel Methods
Going on a cruise ship and flying domestically are the most carbon-intensive travel methods.


The Carbon Footprint of Major Travel Methods
This was originally posted on our Voronoi app. Download the app for free on iOS or Android and discover incredible data-driven charts from a variety of trusted sources.
Did you know that transport accounts for nearly one-quarter of global energy-related carbon dioxide (CO₂) emissions?
This graphic illustrates the carbon footprints of major travel methods measured in grams of carbon dioxide equivalent (CO₂e) emitted per person to travel one kilometer. This includes both CO₂ and other greenhouse gases.
Data is sourced from Our World in Data, the UK Government’s Department for Energy Security and Net Zero, and The International Council on Clean Transportation, as of December 2022.
These figures should be interpreted as approximations, rather than exact numbers. There are many variables at play that determine the actual carbon footprint in any individual case, including vehicle type or model, occupancy, energy mix, and even weather.
Cruise Ships are the Most Carbon-Intensive Travel Method
According to these estimates, taking a cruise ship, flying domestically, and driving alone are some of the most carbon-intensive travel methods.
Cruise ships typically use heavy fuel oil, which is high in carbon content. The average cruise ship weighs between 70,000 to 180,000 metric tons, meaning they require large engines to get moving.
These massive vessels must also generate power for onboard amenities such as lighting, air conditioning, and entertainment systems.
Short-haul flights are also considered carbon-intensive due to the significant amount of fuel consumed during initial takeoff and climbing altitude, relative to a lower amount of cruising.
| Transportation method | CO₂ equivalent emissions per passenger km |
|---|---|
| Cruise Ship | 250 |
| Short-haul flight (i.e. within a U.S. state or European country) | 246 |
| Diesel car | 171 |
| Gas car | 170 |
| Medium-haul flight (i.e. international travel within Europe, or between U.S. states) | 151 |
| Long-haul flight (over 3,700 km, about the distance from LA to NY) | 147 |
| Motorbike | 113 |
| Bus (average) | 96 |
| Plug-in hybrid | 68 |
| Electric car | 47 |
| National rail | 35 |
| Tram | 28 |
| London Underground | 27 |
| Ferry (foot passenger) | 19 |
| Eurostar (International rail) | 4.5 |
Are EVs Greener?
Many experts agree that EVs produce a lower carbon footprint over time versus traditional internal combustion engine (ICE) vehicles.
However, the batteries in electric vehicles charge on the power that comes straight off the electrical grid—which in many places may be powered by fossil fuels. For that reason, the carbon footprint of an EV will depend largely on the blend of electricity sources used for charging.
There are also questions about how energy-intensive it is to build EVs compared to a comparable ICE vehicle.

-

 Debt1 week ago
How Debt-to-GDP Ratios Have Changed Since 2000
-

 Markets2 weeks ago
Ranked: The World’s Top Flight Routes, by Revenue
-

 Countries2 weeks ago
Population Projections: The World’s 6 Largest Countries in 2075
-

 Markets2 weeks ago
The Top 10 States by Real GDP Growth in 2023
-

 Demographics2 weeks ago
The Smallest Gender Wage Gaps in OECD Countries
-

 United States2 weeks ago
Where U.S. Inflation Hit the Hardest in March 2024
-

 Green2 weeks ago
Top Countries By Forest Growth Since 2001
-

 United States2 weeks ago
Ranked: The Largest U.S. Corporations by Number of Employees