

Going on a cruise ship and flying domestically are the most carbon-intensive travel methods.


South Asian nations are the global hotspot for pollution. In this graphic, we rank the world’s most polluted countries according to IQAir.
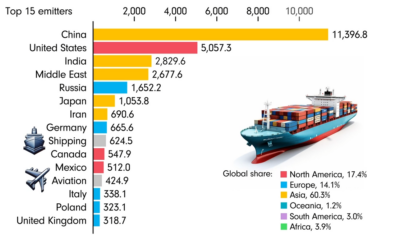

This animated chart by James Eagle uses data from Our World in Data to show the 15 largest carbon emitters between 1850 and 2022.
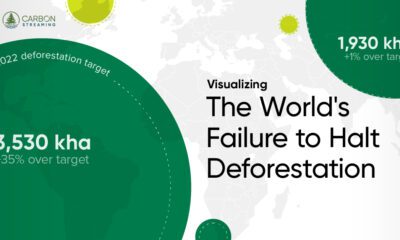

Global deforestation in 2022 rose by 4%, reaching 6.6 million hectares.
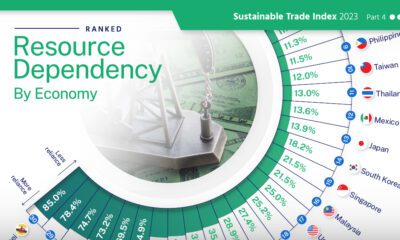

High resource dependency in trade makes countries more susceptible to market fluctuations and climate change.


This infographic lists the top energy priorities in 28 countries, based on an Ipsos survey involving 24,000 people.
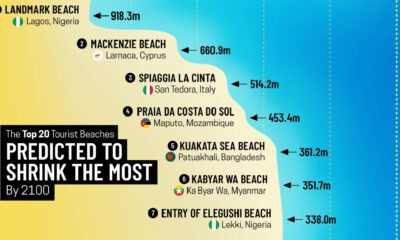

Sandy beaches make up over one-third of the world's coastline, yet nearly half of them could disappear by 2100.


Comparing average Scope 1 emission intensities by sector according to an analysis done by S&P Global Inc.


How much oil is saved by adding electric vehicles into the mix? We look at data from 2015 to 2025P for different types of EVs.
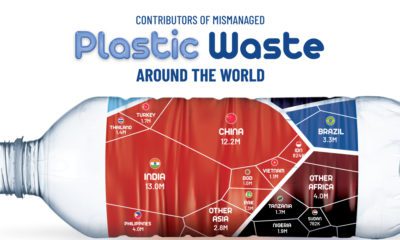

About 22% of the world's annual plastic waste generation is mismanaged. Here's a break down of mismanaged plastic waste by country.


 Creator Program