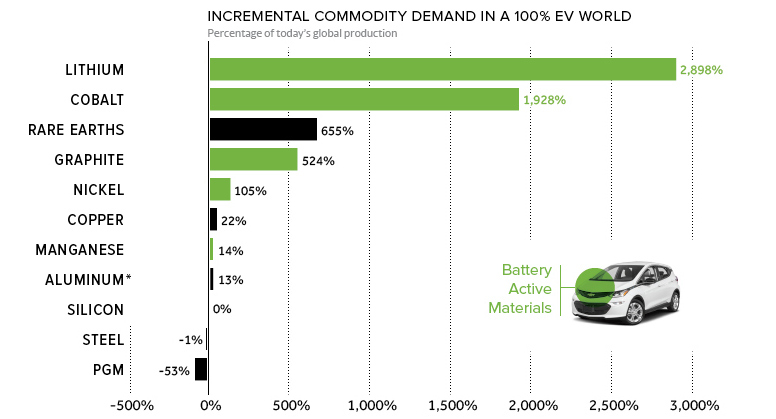
Based on the teardown of a Chevy Bolt, this chart reveals how annual commodity demand would be affected in a hypothetical 100% EV world.
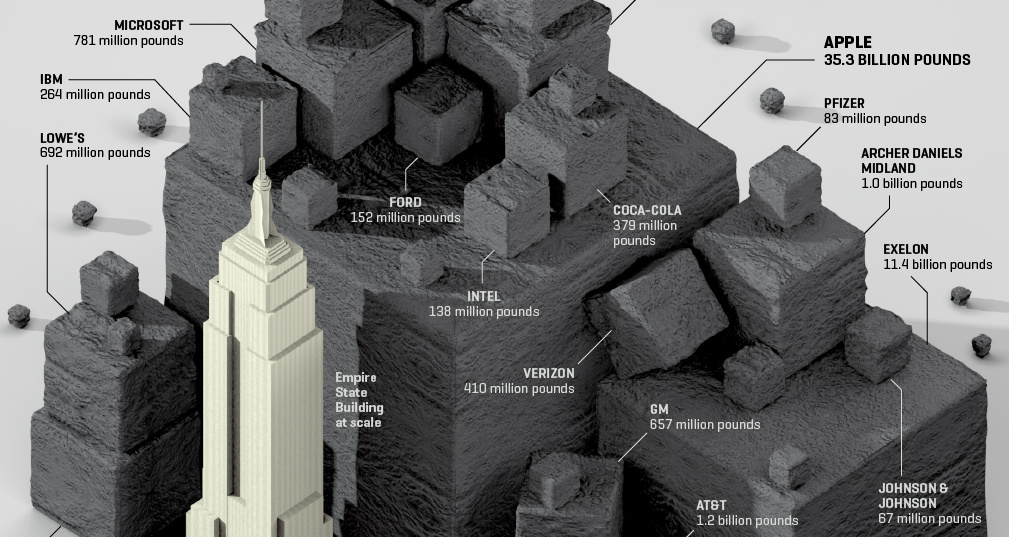
Visualizing the CO2 emissions saved by 56 of the Fortune 100 companies, expressed using the quantity of coal not burned.
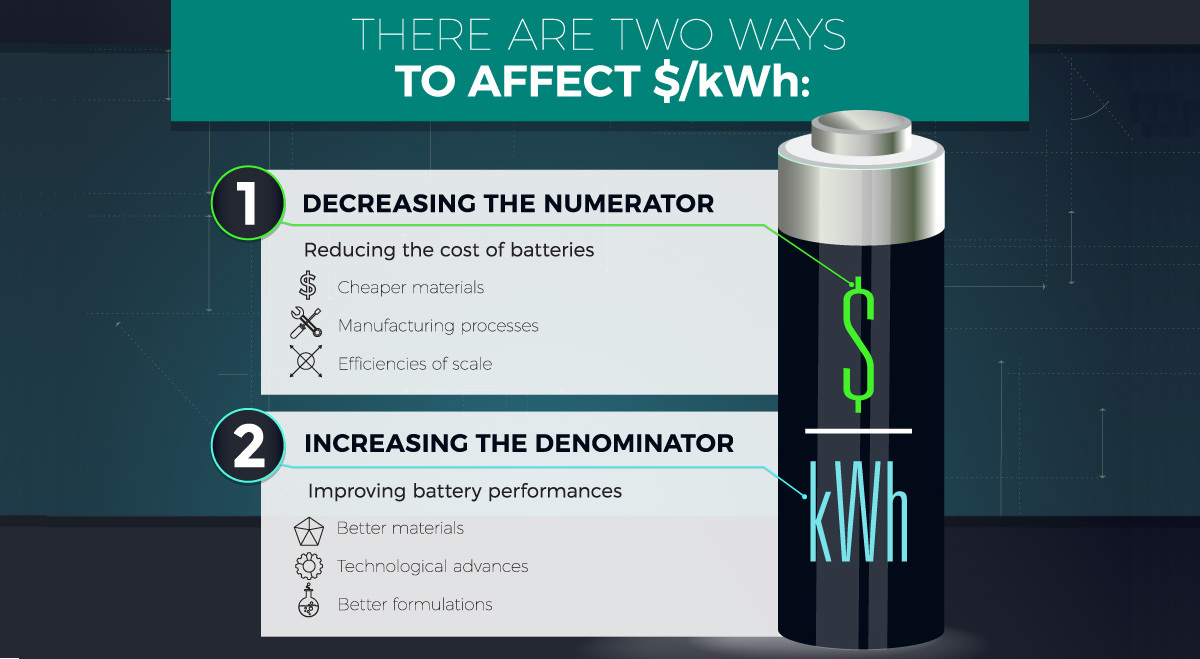
What's the best way to reduce the $/kWh of li-ion batteries? Historically, it's by advances in the cathode, and that may be the case for the...
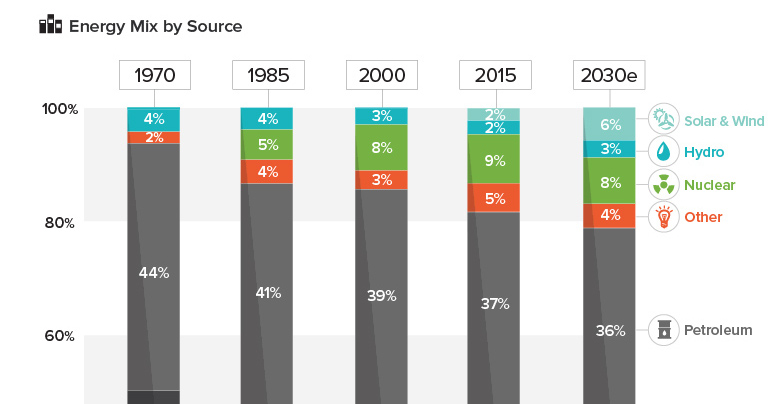
See how America's energy mix has evolved from 1970 until today, as well as a projection for the energy sources to be used in the year...
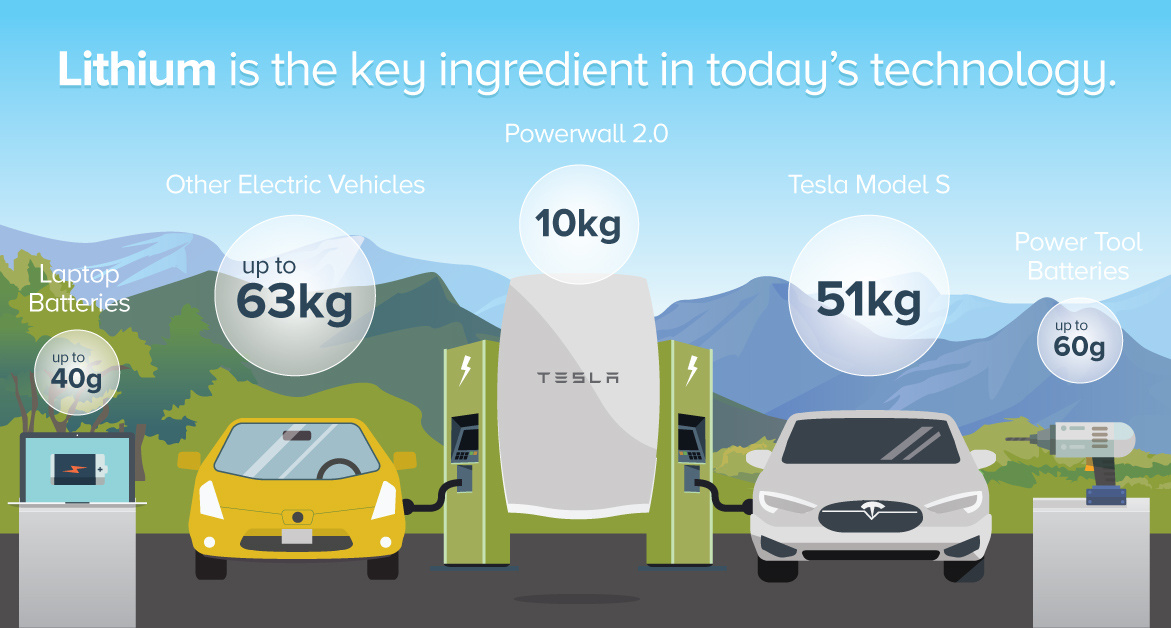
How is lithium-ion powered battery technology fueling the green revolution? See how much of the metal is in various everyday devices in this infographic.
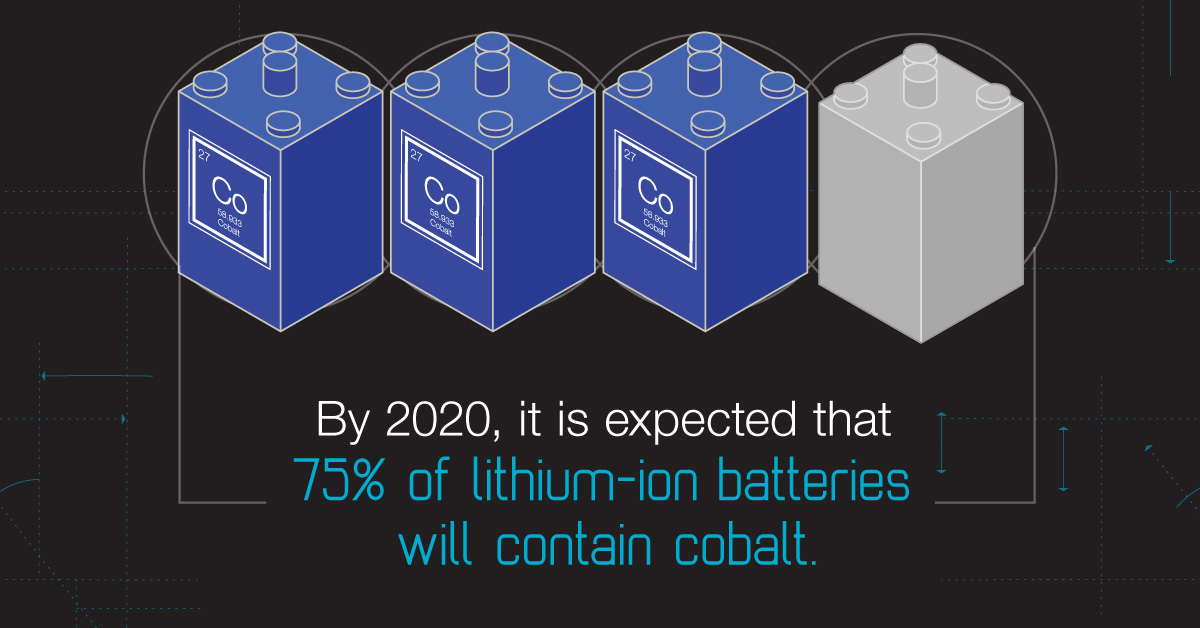
Every once in a while, a previously unappreciated metal rises to prominence. It could be such a time for cobalt - a metal that's fueling the...
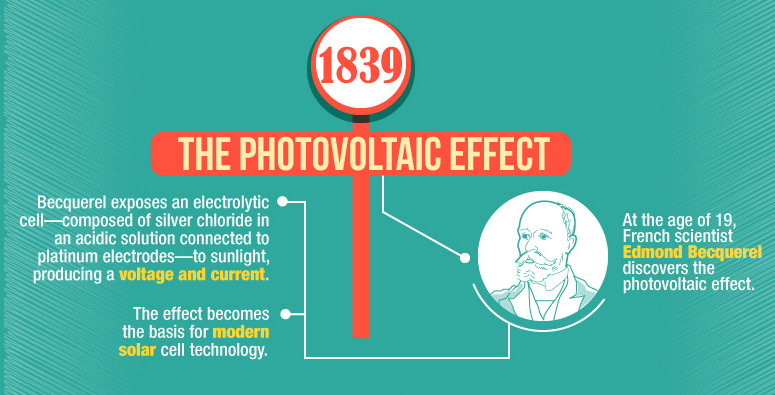
This infographic shows the many technological advances made throughout the history of solar energy - going all the way back to the Neolithic Era in China.

Which new sources of energy have promise? This infographic highlights the upcoming technologies that may provide the alternative energy sources of the future.

This infographic serves as a cheat sheet to the third party candidates in the U.S. Election, covering what Gary Johnson and Jill Stein are all about.
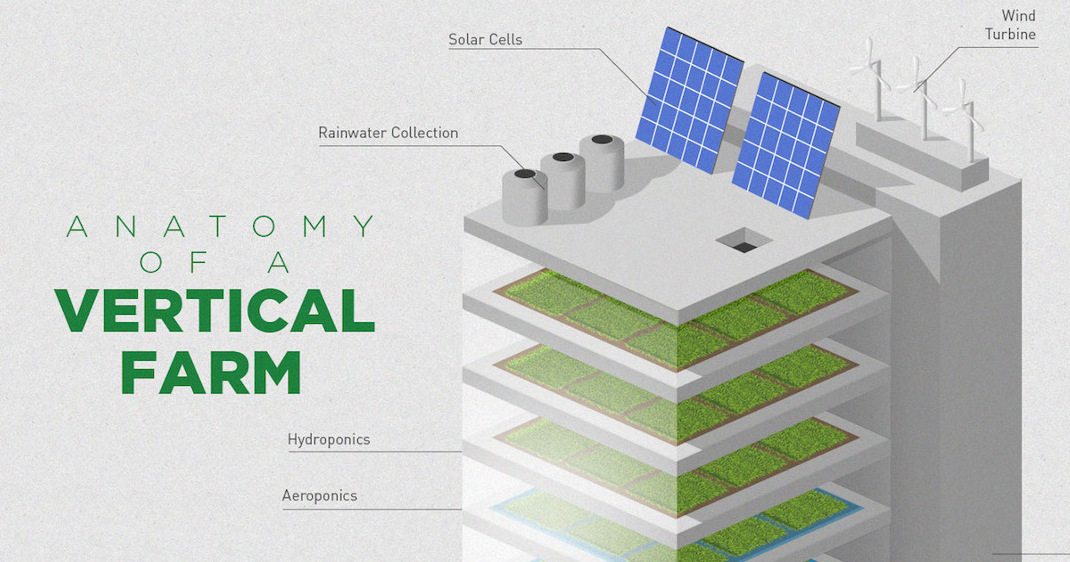
What if a skyscraper could supply sustainable farm food to the city more efficiently and profitably? This infographic explains how vertical farming works.


