Energy
The Top 10 Reasons Investors Should Look at Cobalt
Every once in a while, a previously underappreciated metal rises to prominence.
Several factors can cause this to happen: new technology, changing consumer preferences, supply constraints, or skyrocketing demand can all bring an unknown metal to the forefront of discussion.
Cobalt could be the latest metal that fits this description. It’s a crucial metal to the boom in lithium-ion battery demand, but it also has an increasingly precarious supply chain that could be very volatile moving forward.
Why Investors Should Look at Cobalt
Today’s infographic comes from eCobalt Solutions, a company focused on providing ethically produced and environmentally sound battery grade cobalt salts.
It presents the investment case for the relatively unknown metal.

With the green movement in full swing, there is compelling evidence that cobalt could be the next relatively unknown metal to rise to prominence.
Here are the top 10 reasons that investors should look at cobalt:
1. Cobalt is one of the few metals used for superalloys.
Nearly 20% of all cobalt is used for superalloys – a class of high-tech metals that originally emerged to suit the high operating temperatures of jet engines.
There are three main superalloy types:
- Nickel-based: the bulk of alloys produced
- Cobalt-based: higher melting point gives ability to absorb stress, and corrosion resistance
- Iron-based: the original superalloy, invented prior to the 1940s
Their use has extended into many other fields – and today, superalloys are used in all types of turbines, space vehicles, rocket engines, nuclear reactors, power plants, and chemical equipment.
2. The green economy runs on cobalt.
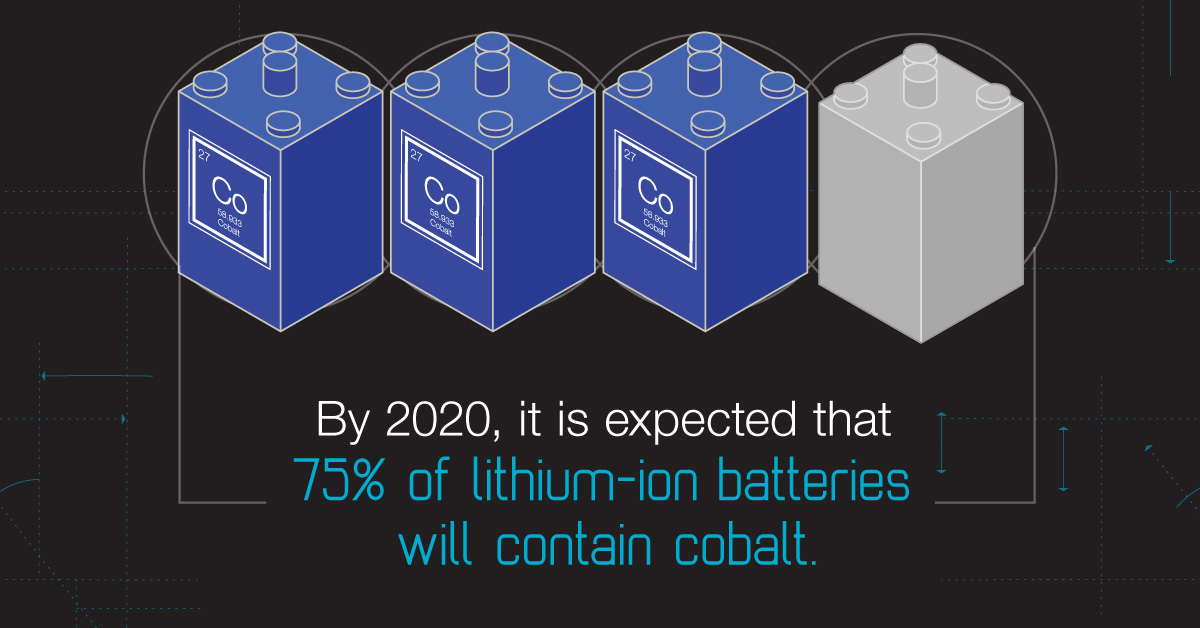
There are many types of lithium-ion batteries, but the vast majority of li-ions sold today use cobalt in some capacity.
In fact, by 2020 it is expected that 75% of lithium-ion batteries will contain cobalt. Why? It’s because cobalt is the most important metal for increasing the energy density of lithium-ion cathodes.
3. …And green uses such as EVs are driving the upwards trajectory of cobalt demand.
By 2020, almost 1/5 of cobalt demand will stem from electric vehicles.
Total refined cobalt demand:
| Year | Demand | % xEV batteries | % Electronics batteries |
|---|---|---|---|
| 2010 | 64,000 | <1% | 30% |
| 2015 | 95,000 | 6% | 36% |
| 2020e | 124,000 | 17% | 31% |
Source: CRU
“Cobalt’s demand growth profile remains one of the best among industrial metals peers. Its exposure to rechargeable batteries continues to play a crucial role.” – Macquarie
4. Getting cobalt is the hard part.
98% of cobalt is produced as a by-product of copper and nickel mines. The problem? If copper and nickel production isn’t growing, then more cobalt isn’t mined to meet demand.
5. Why not find more cobalt?
It’s easier said than done. The vast majority of the world’s cobalt lies in risky regions like the DRC.
| Country | % Cobalt Supply in 2014 |
|---|---|
| DRC | 58% |
| Russia | 6% |
| Cuba | 5% |
| Australia | 5% |
| Philippines | 4% |
| Madagascar | 4% |
| Other | 19% |
Source: CRU
6. And so supply can tighten…
Chemical cobalt – the kind used in batteries, is expected to fall into a growing deficit over the next few years. By 2020, CRU expects that deficit to be at least 12,000 tonnes.
7. Meanwhile, the U.S. government definitely doesn’t have any strategic stockpiles.
According to the U.S Defense Logistics Agency, the government sold off cobalt all the way up until 2008. Now there is only 301 tonnes left in strategic stockpiles.
8. Cobalt was one of the best-performing metals in 2016.
| Metal | 2016 performance |
|---|---|
| Zinc | 66% |
| Cobalt | 47% |
| Nickel | 17% |
| Aluminum | 17% |
| Copper | 17% |
| Silver | 16% |
| Gold | 9% |
| Platinum | 1% |
| Uranium | -42% |
9. Cobalt prices have been rising, but they are nowhere near all-time highs yet.
All-time highs for cobalt prices happened in 2008, after the DRC government placed restrictions on export of ores and concentrates. For a brief stint, cobalt prices even exceeded $50/lb.
The current price? Roughly $16/lb.
10. Many experts predict the cobalt market to be interesting to watch in 2017:
“Just how much cobalt is in stockpiles in China is the Million Dollar Question. Clarity here can materially affect the cobalt price.” Chris Berry, House Mountain Partners, LLC
“The refined cobalt market will fall into a 3,000 tonne deficit this year following seven years of overcapacity and oversupply. CRU anticipates prices to increase onward into 2017…” – Edward Spencer, CRU Group
“With this growth will come further disruption to the traditional market structures that have developed in cobalt over the last 30 years. In short, a new, more secure supply chain for the modern era will need to be created, a task that includes new mines, new refineries, and a more transparent supply chain.” – Andrew Miller, Benchmark Minerals


Energy
The World’s Biggest Nuclear Energy Producers
China has grown its nuclear capacity over the last decade, now ranking second on the list of top nuclear energy producers.


The World’s Biggest Nuclear Energy Producers
This was originally posted on our Voronoi app. Download the app for free on Apple or Android and discover incredible data-driven charts from a variety of trusted sources.
Scientists in South Korea recently broke a record in a nuclear fusion experiment. For 48 seconds, they sustained a temperature seven times that of the sun’s core.
But generating commercially viable energy from nuclear fusion still remains more science fiction than reality. Meanwhile, its more reliable sibling, nuclear fission, has been powering our world for many decades.
In this graphic, we visualized the top producers of nuclear energy by their share of the global total, measured in terawatt hours (TWh). Data for this was sourced from the Nuclear Energy Institute, last updated in August 2022.
Which Country Generates the Most Nuclear Energy?
Nuclear energy production in the U.S. is more than twice the amount produced by China (ranked second) and France (ranked third) put together. In total, the U.S. accounts for nearly 30% of global nuclear energy output.
However, nuclear power only accounts for one-fifth of America’s electricity supply. This is in contrast to France, which generates 60% of its electricity from nuclear plants.
| Rank | Country | Nuclear Energy Produced (TWh) | % of Total |
|---|---|---|---|
| 1 | 🇺🇸 U.S. | 772 | 29% |
| 2 | 🇨🇳 China | 383 | 14% |
| 3 | 🇫🇷 France | 363 | 14% |
| 4 | 🇷🇺 Russia | 208 | 8% |
| 5 | 🇰🇷 South Korea | 150 | 6% |
| 6 | 🇨🇦 Canada | 87 | 3% |
| 7 | 🇺🇦 Ukraine | 81 | 3% |
| 8 | 🇩🇪 Germany | 65 | 2% |
| 9 | 🇯🇵 Japan | 61 | 2% |
| 10 | 🇪🇸 Spain | 54 | 2% |
| 11 | 🇸🇪 Sweden | 51 | 2% |
| 12 | 🇧🇪 Belgium | 48 | 2% |
| 13 | 🇬🇧 UK | 42 | 2% |
| 14 | 🇮🇳 India | 40 | 2% |
| 15 | 🇨🇿 Czech Republic | 29 | 1% |
| N/A | 🌐 Other | 219 | 8% |
| N/A | 🌍 Total | 2,653 | 100% |
Another highlight is how China has rapidly grown its nuclear energy capabilities in the last decade. Between 2016 and 2021, for example, it increased its share of global nuclear energy output from less than 10% to more than 14%, overtaking France for second place.
On the opposite end, the UK’s share has slipped to 2% over the same time period.
Meanwhile, Ukraine has heavily relied on nuclear energy to power its grid. In March 2022, it lost access to its key Zaporizhzhia Nuclear Power Station after Russian forces wrested control of the facility. With six 1,000 MW reactors, the plant is one of the largest in Europe. It is currently not producing any power, and has been the site of recent drone attacks.

-

 Green2 weeks ago
Ranked: Top Countries by Total Forest Loss Since 2001
-

 Travel1 week ago
Ranked: The World’s Top Flight Routes, by Revenue
-

 Technology1 week ago
Ranked: Semiconductor Companies by Industry Revenue Share
-

 Money2 weeks ago
Which States Have the Highest Minimum Wage in America?
-

 Real Estate2 weeks ago
Ranked: The Most Valuable Housing Markets in America
-

 Markets2 weeks ago
Charted: Big Four Market Share by S&P 500 Audits
-

 AI2 weeks ago
The Stock Performance of U.S. Chipmakers So Far in 2024
-

 Misc2 weeks ago
Almost Every EV Stock is Down After Q1 2024