Energy
The Cathode is the Key to Advancing Lithium-Ion Technology

Cathodes: The Key to Advancing Lithium-Ion Technology
The inner-workings of most commercialized batteries are typically pretty straightforward.
The lead-acid battery, which is the traditional battery used in the automotive sector, is as easy as it gets. Put two lead plates in sulphuric acid, and you’re off to the races.
However, lithium-ion batteries are almost infinitely more complex than their predecessors. That’s because “lithium-ion” refers to a mechanism – the transfer of lithium-ions – which can occur in a variety of cathode, anode, and electrolyte environments. As a result, there’s not just one type of lithium-ion battery, but instead the name acts as an umbrella that represents thousands of different formulations that could work.
The Cathode’s Importance
Today’s infographic comes to us from Nano One, a Canadian tech company that specializes in battery materials, and it provides interesting context on lithium-ion battery advancements over the last couple of decades.
Since the commercialization of the lithium-ion battery in the 1990s, there have been relatively few developments in the materials or technology used for anodes and electrolytes. For example, graphite is still the material of choice for anodes, though researchers are trying to figure out how to make the switch over to silicon. Meanwhile, the electrolyte is typically a lithium salt in an organic solvent (except in lithium-ion polymer batteries).
Cathodes, on the other hand, are a very different story. That’s because they are usually made up of metal oxides or phosphates – and there are many different possible combinations that can be used.
Here are five examples of commercialized cathode formulations, and the metals needed for them (aside from lithium):
| Cathode Type | Chemistry | Example Metal Portions | Example Use |
|---|---|---|---|
| NCA | LiNiCoAlO2 | 80% Nickel, 15% Cobalt, 5% Aluminum | Tesla Model S |
| LCO | LiCoO2 | 100% Cobalt | Apple iPhone |
| LMO | LiMn2O4 | 100% Manganese | Nissan Leaf |
| NMC | LiNiMnCoO2 | Nickel 33.3%, Manganese 33.3%, Cobalt 33.3% | Tesla Powerwall |
| LFP | LiFePO4 | 100% Iron | Starter batteries |
Lithium, cobalt, manganese, nickel, aluminum, and iron are just some of the metals used in current lithium-ion batteries out there – and each battery type has considerably different properties. The type of cathode chosen can affect the energy density, power density, safety, cycle life, and cost of the overall battery, and this is why researchers are constantly experimenting with new ideas and combinations.
Drilling Down
For companies like Tesla, which wants the exit rate of lithium-ion cells to be faster than “bullets from a machine gun”, the cathode is of paramount importance. Historically, it’s where most advancements in lithium-ion battery technology have been made.
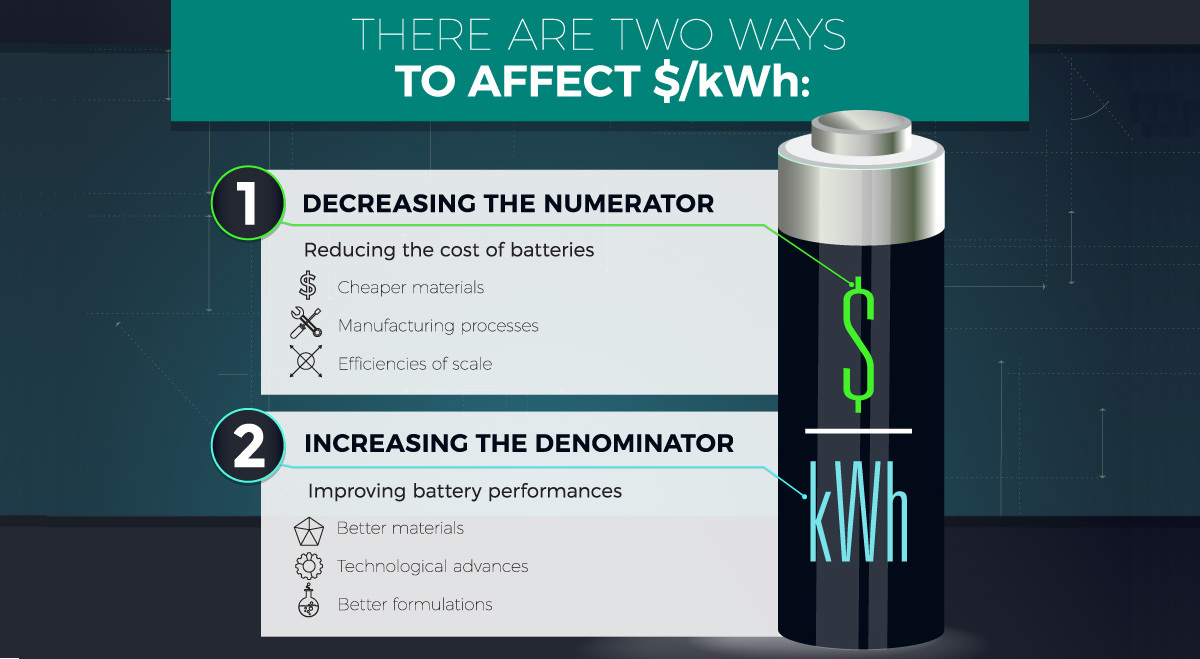
Cathode choice is a major factor for determining battery energy density, and cathodes also typically account for 25% of lithium-ion battery costs. That means the cathode can impact both the performance and cost pieces of the $/kWh equation – and building a better cathode will likely be a key driver for the success of the green revolution.
Luckily, the future of cathode development has many exciting prospects. These include concepts such as building cathodes with layered-layered composite structures or orthosilicates, as well as improvements to the fundamental material processes used in cathode assembly.
As these new technologies are applied, the cost of lithium-ion batteries will continue to decrease. In fact, experts are now saying that it won’t be long before batteries will hit $80/kWh – a cost that would make EVs undeniably cheaper than traditional gas-powered vehicles.


Energy
Charted: 4 Reasons Why Lithium Could Be the Next Gold Rush
Visual Capitalist has partnered with EnergyX to show why drops in prices and growing demand may make now the right time to invest in lithium.


4 Reasons Why You Should Invest in Lithium
Lithium’s importance in powering EVs makes it a linchpin of the clean energy transition and one of the world’s most precious minerals.
In this graphic, Visual Capitalist partnered with EnergyX to explore why now may be the time to invest in lithium.
1. Lithium Prices Have Dropped
One of the most critical aspects of evaluating an investment is ensuring that the asset’s value is higher than its price would indicate. Lithium is integral to powering EVs, and, prices have fallen fast over the last year:
| Date | LiOH·H₂O* | Li₂CO₃** |
|---|---|---|
| Feb 2023 | $76 | $71 |
| March 2023 | $71 | $61 |
| Apr 2023 | $43 | $33 |
| May 2023 | $43 | $33 |
| June 2023 | $47 | $45 |
| July 2023 | $44 | $40 |
| Aug 2023 | $35 | $35 |
| Sept 2023 | $28 | $27 |
| Oct 2023 | $24 | $23 |
| Nov 2023 | $21 | $21 |
| Dec 2023 | $17 | $16 |
| Jan 2024 | $14 | $15 |
| Feb 2024 | $13 | $14 |
Note: Monthly spot prices were taken as close to the 14th of each month as possible.
*Lithium hydroxide monohydrate MB-LI-0033
**Lithium carbonate MB-LI-0029
2. Lithium-Ion Battery Prices Are Also Falling
The drop in lithium prices is just one reason to invest in the metal. Increasing economies of scale, coupled with low commodity prices, have caused the cost of lithium-ion batteries to drop significantly as well.
In fact, BNEF reports that between 2013 and 2023, the price of a Li-ion battery dropped by 82%.
| Year | Price per KWh |
|---|---|
| 2023 | $139 |
| 2022 | $161 |
| 2021 | $150 |
| 2020 | $160 |
| 2019 | $183 |
| 2018 | $211 |
| 2017 | $258 |
| 2016 | $345 |
| 2015 | $448 |
| 2014 | $692 |
| 2013 | $780 |

3. EV Adoption is Sustainable
One of the best reasons to invest in lithium is that EVs, one of the main drivers behind the demand for lithium, have reached a price point similar to that of traditional vehicle.
According to the Kelly Blue Book, Tesla’s average transaction price dropped by 25% between 2022 and 2023, bringing it in line with many other major manufacturers and showing that EVs are a realistic transport option from a consumer price perspective.
| Manufacturer | September 2022 | September 2023 |
|---|---|---|
| BMW | $69,000 | $72,000 |
| Ford | $54,000 | $56,000 |
| Volkswagon | $54,000 | $56,000 |
| General Motors | $52,000 | $53,000 |
| Tesla | $68,000 | $51,000 |
4. Electricity Demand in Transport is Growing
As EVs become an accessible transport option, there’s an investment opportunity in lithium. But possibly the best reason to invest in lithium is that the IEA reports global demand for the electricity in transport could grow dramatically by 2030:
| Transport Type | 2022 | 2025 | 2030 |
|---|---|---|---|
| Buses 🚌 | 23,000 GWh | 50,000 GWh | 130,000 GWh |
| Cars 🚙 | 65,000 GWh | 200,000 GWh | 570,000 GWh |
| Trucks 🛻 | 4,000 GWh | 15,000 GWh | 94,000 GWh |
| Vans 🚐 | 6,000 GWh | 16,000 GWh | 72,000 GWh |
The Lithium Investment Opportunity
Lithium presents a potentially classic investment opportunity. Lithium and battery prices have dropped significantly, and recently, EVs have reached a price point similar to other vehicles. By 2030, the demand for clean energy, especially in transport, will grow dramatically.
With prices dropping and demand skyrocketing, now is the time to invest in lithium.
EnergyX is poised to exploit lithium demand with cutting-edge lithium extraction technology capable of extracting 300% more lithium than current processes.

-

 Lithium2 days ago
Ranked: The Top 10 EV Battery Manufacturers in 2023
Asia dominates this ranking of the world’s largest EV battery manufacturers in 2023.
-

 Energy7 days ago
The World’s Biggest Nuclear Energy Producers
China has grown its nuclear capacity over the last decade, now ranking second on the list of top nuclear energy producers.
-

 Energy4 weeks ago
The World’s Biggest Oil Producers in 2023
Just three countries accounted for 40% of global oil production last year.
-

 Energy1 month ago
How Much Does the U.S. Depend on Russian Uranium?
Currently, Russia is the largest foreign supplier of nuclear power fuel to the U.S.
-

 Uranium2 months ago
Charted: Global Uranium Reserves, by Country
We visualize the distribution of the world’s uranium reserves by country, with 3 countries accounting for more than half of total reserves.
-

 Energy2 months ago
Visualizing the Rise of the U.S. as Top Crude Oil Producer
Over the last decade, the United States has established itself as the world’s top producer of crude oil, surpassing Saudi Arabia and Russia.


-

 Green1 week ago
Ranked: The Countries With the Most Air Pollution in 2023
-

 Misc2 weeks ago
Almost Every EV Stock is Down After Q1 2024
-

 AI2 weeks ago
The Stock Performance of U.S. Chipmakers So Far in 2024
-

 Markets2 weeks ago
Charted: Big Four Market Share by S&P 500 Audits
-

 Real Estate2 weeks ago
Ranked: The Most Valuable Housing Markets in America
-

 Money2 weeks ago
Which States Have the Highest Minimum Wage in America?
-

 AI2 weeks ago
Ranked: Semiconductor Companies by Industry Revenue Share
-

 Travel2 weeks ago
Ranked: The World’s Top Flight Routes, by Revenue