Energy
Infographic: Emissions Change Starts at the Top
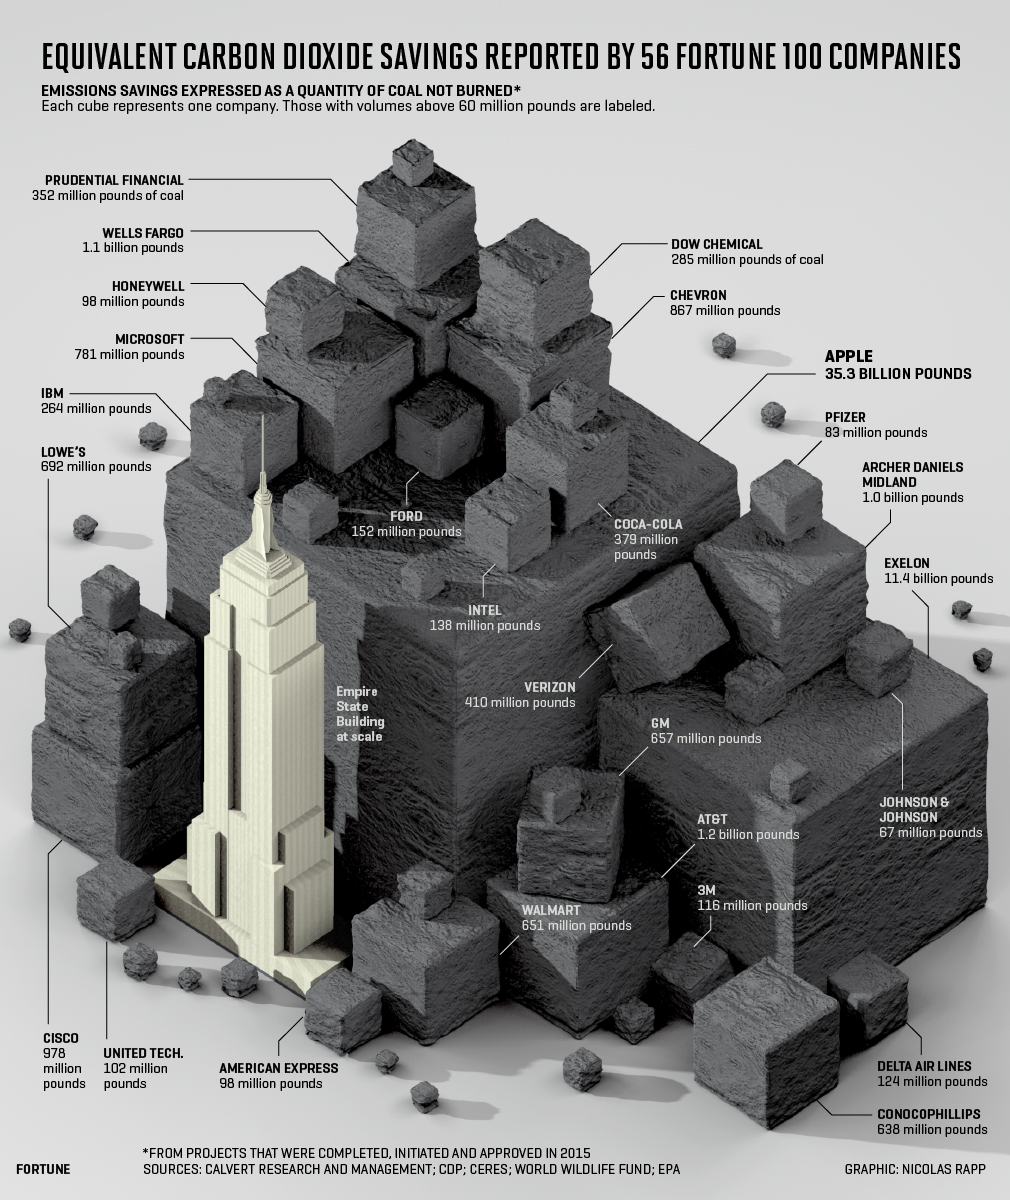
Emissions Change Starts at Top
Some of the largest companies in America are also those leading the charge toward a more sustainable future, according to a joint report by Calvert Research, WWF, CDP, and Ceres.
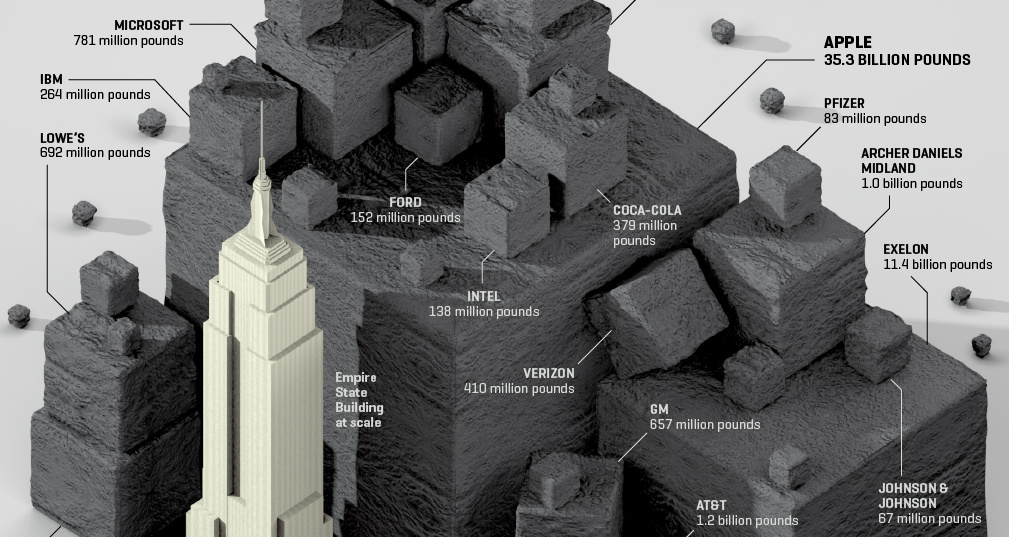
Today’s infographic comes from Fortune’s Nicolas Rapp, who used this data to visualize the CO2 emissions saved by 56 of the Fortune top 100 firms. In the graphic, each company’s CO2 savings are represented by an equivalent mass of coal not burned.
Big Companies, Big Goals
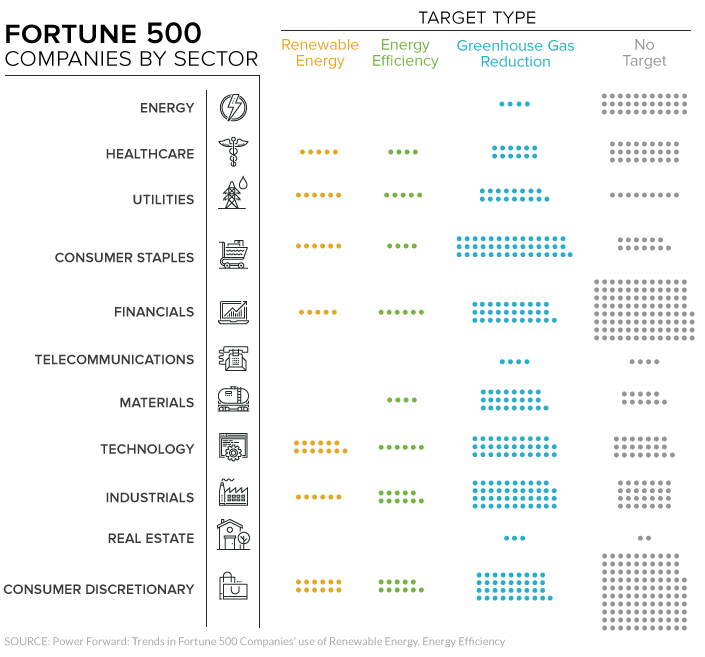
Nearly half (49%) of Fortune 500 companies in 2016 set targets to increase renewable energy sourcing, improve energy efficiency, or reduce greenhouse gas emissions (GHGs).
Over the course of the year, 190 of these companies managed to report a total $3.7 billion in cost savings thanks to some 80,000 emissions-reducing projects. That’s roughly equal to the impact of taking 45 coal-fired power plants offline.
Computing Giants Using Power Responsibly
Apple has done more than any other company on the Fortune list to reduce their environmental impact, saving the equivalent emissions of 35 billion pounds of burned coal. This alone would be enough to meet the year-round power consumption needs of 9.7 million homes – more than in the entirety of New York state.
What types of initiatives are they implementing to make these kinds of efforts?
According to their 2017 Sustainability Report, 96% of Apple’s electricity comes from renewable sources, including hydroelectric and solar. The company also recently issued $1 billion in “green bonds”, the proceeds of which are to be used in eco-friendly projects. This is in addition to an existing issue of $1.5 billion of green bonds from 2016.
On the other hand, Microsoft is focused on energy efficiency, with the bulk of its work going towards improving the efficiency of data centers and buildings. As of 2016, roughly 44% of the electricity used by Microsoft data centers originates from wind, solar, and hydro energy sources.
Solar Power Shines for Big Box Retailers
Walmart, the largest brick and mortar retailer in the U.S., is also one of the biggest corporate users of solar power in the country. In 2005, Walmart’s former CEO, Lee Scott, set goals for the company’s store network to be powered entirely with renewable energy.
Though they have not met this goal yet, Walmart’s adoption of solar has reduced its energy costs per square foot of retail floor space by 9% chainwide. Other companies with large installations of onsite solar panels include Prologis, Apple, Costco, Kohl’s, and IKEA.
Are Clear Skies Ahead?
With the impending review of the Clean Power Plan’s role in American energy policy, the onus on large and powerful corporations to minimize their environmental impact is now greater than ever. Though we can already see the massive scale on which these firms have been able to improve their carbon footprints, even the equivalent of 35 billion pounds of burned coal is just the tip of the iceberg.


Energy
Charted: 4 Reasons Why Lithium Could Be the Next Gold Rush
Visual Capitalist has partnered with EnergyX to show why drops in prices and growing demand may make now the right time to invest in lithium.


4 Reasons Why You Should Invest in Lithium
Lithium’s importance in powering EVs makes it a linchpin of the clean energy transition and one of the world’s most precious minerals.
In this graphic, Visual Capitalist partnered with EnergyX to explore why now may be the time to invest in lithium.
1. Lithium Prices Have Dropped
One of the most critical aspects of evaluating an investment is ensuring that the asset’s value is higher than its price would indicate. Lithium is integral to powering EVs, and, prices have fallen fast over the last year:
| Date | LiOH·H₂O* | Li₂CO₃** |
|---|---|---|
| Feb 2023 | $76 | $71 |
| March 2023 | $71 | $61 |
| Apr 2023 | $43 | $33 |
| May 2023 | $43 | $33 |
| June 2023 | $47 | $45 |
| July 2023 | $44 | $40 |
| Aug 2023 | $35 | $35 |
| Sept 2023 | $28 | $27 |
| Oct 2023 | $24 | $23 |
| Nov 2023 | $21 | $21 |
| Dec 2023 | $17 | $16 |
| Jan 2024 | $14 | $15 |
| Feb 2024 | $13 | $14 |
Note: Monthly spot prices were taken as close to the 14th of each month as possible.
*Lithium hydroxide monohydrate MB-LI-0033
**Lithium carbonate MB-LI-0029
2. Lithium-Ion Battery Prices Are Also Falling
The drop in lithium prices is just one reason to invest in the metal. Increasing economies of scale, coupled with low commodity prices, have caused the cost of lithium-ion batteries to drop significantly as well.
In fact, BNEF reports that between 2013 and 2023, the price of a Li-ion battery dropped by 82%.
| Year | Price per KWh |
|---|---|
| 2023 | $139 |
| 2022 | $161 |
| 2021 | $150 |
| 2020 | $160 |
| 2019 | $183 |
| 2018 | $211 |
| 2017 | $258 |
| 2016 | $345 |
| 2015 | $448 |
| 2014 | $692 |
| 2013 | $780 |

3. EV Adoption is Sustainable
One of the best reasons to invest in lithium is that EVs, one of the main drivers behind the demand for lithium, have reached a price point similar to that of traditional vehicle.
According to the Kelly Blue Book, Tesla’s average transaction price dropped by 25% between 2022 and 2023, bringing it in line with many other major manufacturers and showing that EVs are a realistic transport option from a consumer price perspective.
| Manufacturer | September 2022 | September 2023 |
|---|---|---|
| BMW | $69,000 | $72,000 |
| Ford | $54,000 | $56,000 |
| Volkswagon | $54,000 | $56,000 |
| General Motors | $52,000 | $53,000 |
| Tesla | $68,000 | $51,000 |
4. Electricity Demand in Transport is Growing
As EVs become an accessible transport option, there’s an investment opportunity in lithium. But possibly the best reason to invest in lithium is that the IEA reports global demand for the electricity in transport could grow dramatically by 2030:
| Transport Type | 2022 | 2025 | 2030 |
|---|---|---|---|
| Buses 🚌 | 23,000 GWh | 50,000 GWh | 130,000 GWh |
| Cars 🚙 | 65,000 GWh | 200,000 GWh | 570,000 GWh |
| Trucks 🛻 | 4,000 GWh | 15,000 GWh | 94,000 GWh |
| Vans 🚐 | 6,000 GWh | 16,000 GWh | 72,000 GWh |
The Lithium Investment Opportunity
Lithium presents a potentially classic investment opportunity. Lithium and battery prices have dropped significantly, and recently, EVs have reached a price point similar to other vehicles. By 2030, the demand for clean energy, especially in transport, will grow dramatically.
With prices dropping and demand skyrocketing, now is the time to invest in lithium.
EnergyX is poised to exploit lithium demand with cutting-edge lithium extraction technology capable of extracting 300% more lithium than current processes.

-

 Lithium2 days ago
Ranked: The Top 10 EV Battery Manufacturers in 2023
Asia dominates this ranking of the world’s largest EV battery manufacturers in 2023.
-

 Energy1 week ago
The World’s Biggest Nuclear Energy Producers
China has grown its nuclear capacity over the last decade, now ranking second on the list of top nuclear energy producers.
-

 Energy4 weeks ago
The World’s Biggest Oil Producers in 2023
Just three countries accounted for 40% of global oil production last year.
-

 Energy1 month ago
How Much Does the U.S. Depend on Russian Uranium?
Currently, Russia is the largest foreign supplier of nuclear power fuel to the U.S.
-

 Uranium2 months ago
Charted: Global Uranium Reserves, by Country
We visualize the distribution of the world’s uranium reserves by country, with 3 countries accounting for more than half of total reserves.
-

 Energy3 months ago
Visualizing the Rise of the U.S. as Top Crude Oil Producer
Over the last decade, the United States has established itself as the world’s top producer of crude oil, surpassing Saudi Arabia and Russia.


-

 Markets1 week ago
U.S. Debt Interest Payments Reach $1 Trillion
-

 Business2 weeks ago
Charted: Big Four Market Share by S&P 500 Audits
-

 Real Estate2 weeks ago
Ranked: The Most Valuable Housing Markets in America
-

 Money2 weeks ago
Which States Have the Highest Minimum Wage in America?
-

 AI2 weeks ago
Ranked: Semiconductor Companies by Industry Revenue Share
-

 Markets2 weeks ago
Ranked: The World’s Top Flight Routes, by Revenue
-

 Demographics2 weeks ago
Population Projections: The World’s 6 Largest Countries in 2075
-

 Markets2 weeks ago
The Top 10 States by Real GDP Growth in 2023