Green
Ranked: The Countries With the Most Air Pollution in 2023
![]() See this visualization first on the Voronoi app.
See this visualization first on the Voronoi app.
Visualizing the Most Air Polluted Countries in 2023
This was originally posted on our Voronoi app. Download the app for free on iOS or Android and discover incredible data-driven charts from a variety of trusted sources.
Almost the entire global population breathes air that exceeds the air quality limits set by the World Health Organization (WHO).
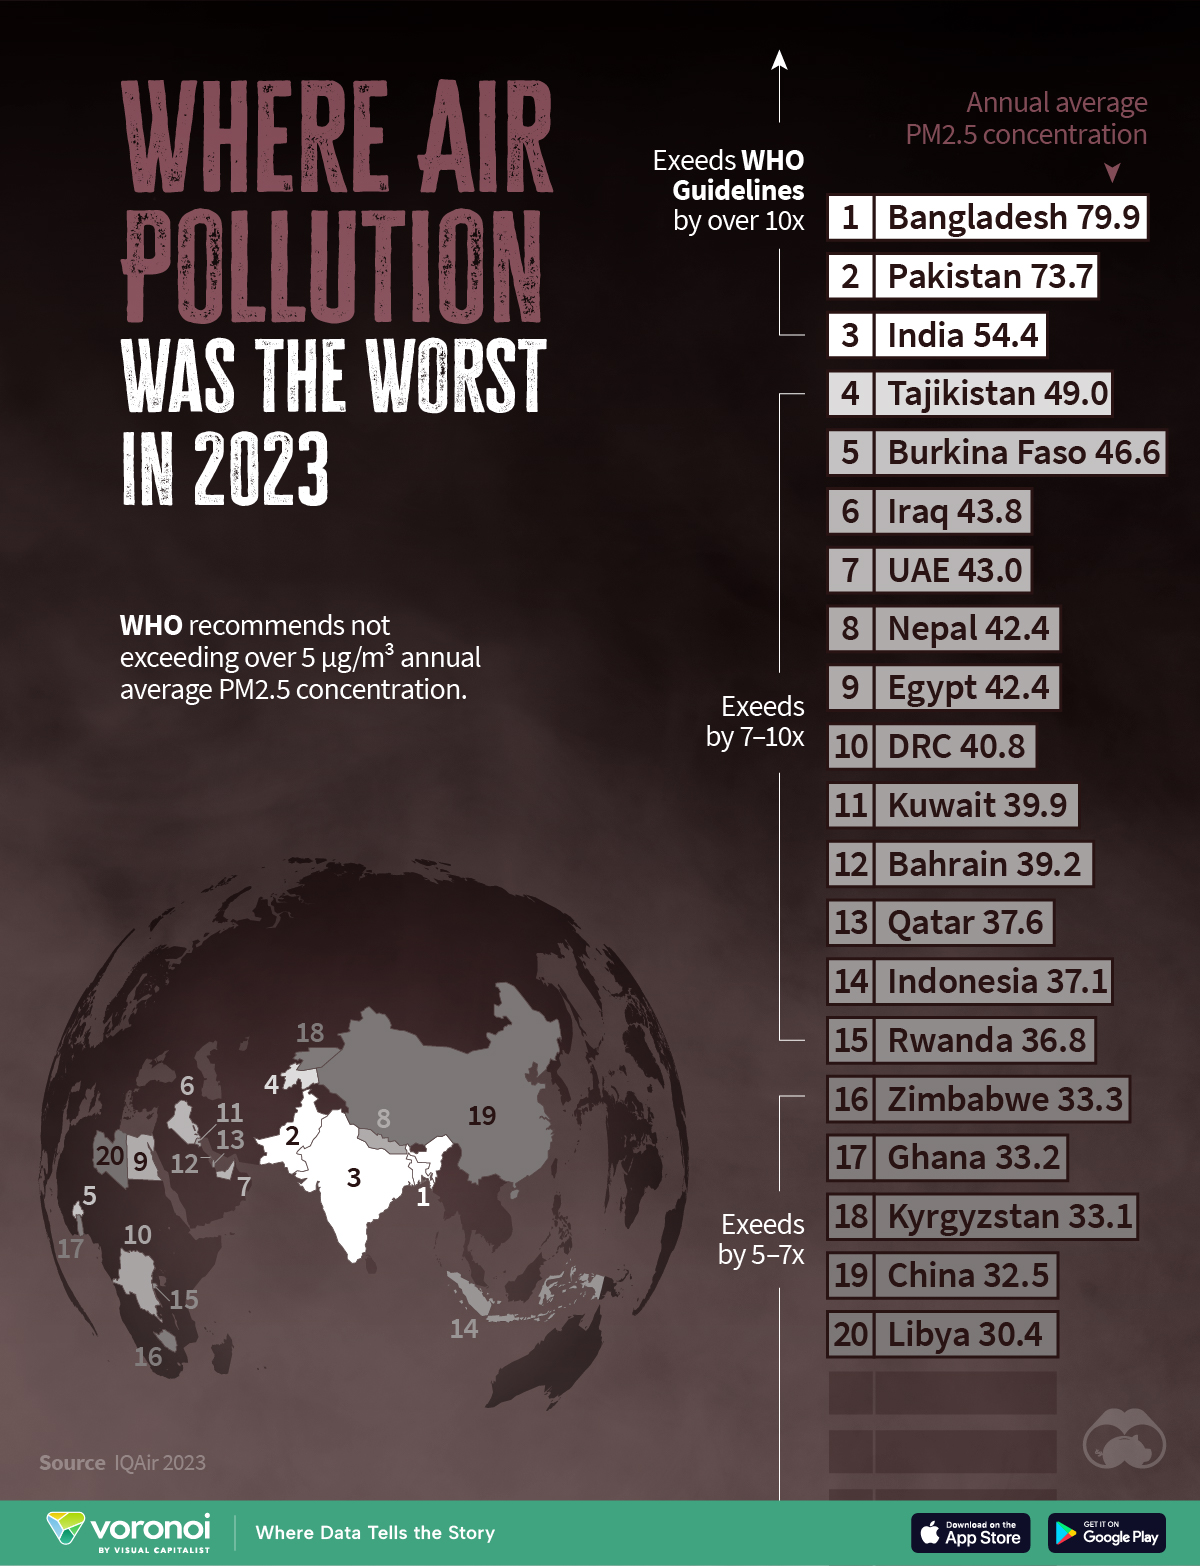
In this graphic, we map the world’s most polluted countries according to IQAir, ranked by their annual average PM2.5 concentration (μg/m³) in 2023. The unit μg/m³ refers to micrograms per cubic meter.
What is PM2.5?
PM2.5 refers to fine particulate matter, with a diameter of 2.5 micrometers or less, that can travel deep into your lungs and cause health problems.
In 2021, the World Health Organization (WHO) updated its air quality guidelines for PM2.5. The recommended maximum annual average level for PM2.5 is now 5 μg/m³, down from the previous target of 10 μg/m³.
Common sources of PM2.5 pollution include engine exhaust, power plant combustion, smoke from fires, dust, and dirt.
How Does PM2.5 Pollution Affect Humans?
Research published in 2022 from the Air Quality Life Index (AQLI) found that 97.3% of the world’s population is exposed to levels of PM2.5 that exceed the WHO guidelines.
This takes 2.2 years off the global average life expectancy, relative to a world that met the WHO guideline.
In South Asia specifically, the AQLI believes residents could be losing up to 5 years off their lives. The region has been a global hotspot of air pollution for years, home to 37 of the 40 most polluted cities in the world.
| Rank | Country | Annual average PM2.5 concentration |
|---|---|---|
| 1 | 🇧🇩 Bangladesh | 79.9 |
| 2 | 🇵🇰 Pakistan | 73.7 |
| 3 | 🇮🇳 India | 54.4 |
| 4 | 🇹🇯 Tajikistan | 49.0 |
| 5 | 🇧🇫 Burkina Faso | 46.6 |
| 6 | 🇮🇶 Iraq | 43.8 |
| 7 | 🇦🇪 United Arab Emirates | 43.0 |
| 8 | 🇳🇵 Nepal | 42.4 |
| 9 | 🇪🇬 Egypt | 42.4 |
| 10 | 🇨🇩 Democratic Republic of the Congo | 40.8 |
| 11 | 🇰🇼 Kuwait | 39.9 |
| 12 | 🇧🇭 Bahrain | 39.2 |
| 13 | 🇶🇦 Qatar | 37.6 |
| 14 | 🇮🇩 Indonesia | 37.1 |
| 15 | 🇷🇼 Rwanda | 36.8 |
| 16 | 🇿🇼 Zimbabwe | 33.3 |
| 17 | 🇬🇭 Ghana | 33.2 |
| 18 | 🇰🇬 Kyrgyzstan | 33.1 |
| 19 | 🇨🇳 China | 32.5 |
| 20 | 🇱🇾 Libya | 30.4 |
Interestingly, fine particulate matter can travel hundreds of kilometers, often crossing national boundaries.
For instance, approximately 30% of air pollution in the Indian state of Punjab originates from neighboring Pakistan. Similarly, an estimated 30% of pollution in Bangladesh’s largest cities is traced back to India.


Green
The Carbon Footprint of Major Travel Methods
Going on a cruise ship and flying domestically are the most carbon-intensive travel methods.


The Carbon Footprint of Major Travel Methods
This was originally posted on our Voronoi app. Download the app for free on iOS or Android and discover incredible data-driven charts from a variety of trusted sources.
Did you know that transport accounts for nearly one-quarter of global energy-related carbon dioxide (CO₂) emissions?
This graphic illustrates the carbon footprints of major travel methods measured in grams of carbon dioxide equivalent (CO₂e) emitted per person to travel one kilometer. This includes both CO₂ and other greenhouse gases.
Data is sourced from Our World in Data, the UK Government’s Department for Energy Security and Net Zero, and The International Council on Clean Transportation, as of December 2022.
These figures should be interpreted as approximations, rather than exact numbers. There are many variables at play that determine the actual carbon footprint in any individual case, including vehicle type or model, occupancy, energy mix, and even weather.
Cruise Ships are the Most Carbon-Intensive Travel Method
According to these estimates, taking a cruise ship, flying domestically, and driving alone are some of the most carbon-intensive travel methods.
Cruise ships typically use heavy fuel oil, which is high in carbon content. The average cruise ship weighs between 70,000 to 180,000 metric tons, meaning they require large engines to get moving.
These massive vessels must also generate power for onboard amenities such as lighting, air conditioning, and entertainment systems.
Short-haul flights are also considered carbon-intensive due to the significant amount of fuel consumed during initial takeoff and climbing altitude, relative to a lower amount of cruising.
| Transportation method | CO₂ equivalent emissions per passenger km |
|---|---|
| Cruise Ship | 250 |
| Short-haul flight (i.e. within a U.S. state or European country) | 246 |
| Diesel car | 171 |
| Gas car | 170 |
| Medium-haul flight (i.e. international travel within Europe, or between U.S. states) | 151 |
| Long-haul flight (over 3,700 km, about the distance from LA to NY) | 147 |
| Motorbike | 113 |
| Bus (average) | 96 |
| Plug-in hybrid | 68 |
| Electric car | 47 |
| National rail | 35 |
| Tram | 28 |
| London Underground | 27 |
| Ferry (foot passenger) | 19 |
| Eurostar (International rail) | 4.5 |
Are EVs Greener?
Many experts agree that EVs produce a lower carbon footprint over time versus traditional internal combustion engine (ICE) vehicles.
However, the batteries in electric vehicles charge on the power that comes straight off the electrical grid—which in many places may be powered by fossil fuels. For that reason, the carbon footprint of an EV will depend largely on the blend of electricity sources used for charging.
There are also questions about how energy-intensive it is to build EVs compared to a comparable ICE vehicle.

-

 Debt1 week ago
How Debt-to-GDP Ratios Have Changed Since 2000
-

 Markets3 weeks ago
Ranked: The World’s Top Flight Routes, by Revenue
-

 Countries2 weeks ago
Population Projections: The World’s 6 Largest Countries in 2075
-

 Markets2 weeks ago
The Top 10 States by Real GDP Growth in 2023
-

 Demographics2 weeks ago
The Smallest Gender Wage Gaps in OECD Countries
-

 United States2 weeks ago
Where U.S. Inflation Hit the Hardest in March 2024
-

 Environment2 weeks ago
Top Countries By Forest Growth Since 2001
-

 United States2 weeks ago
Ranked: The Largest U.S. Corporations by Number of Employees