Money
Where Does One U.S. Tax Dollar Go?
![]() See this visualization first on the Voronoi app.
See this visualization first on the Voronoi app.
Where Does One U.S. Tax Dollar Go?
This was originally posted on our Voronoi app. Download the app for free on Apple or Android and discover incredible data-driven charts from a variety of trusted sources.
Come tax season, a common refrain is: “what do my taxes even pay for?”
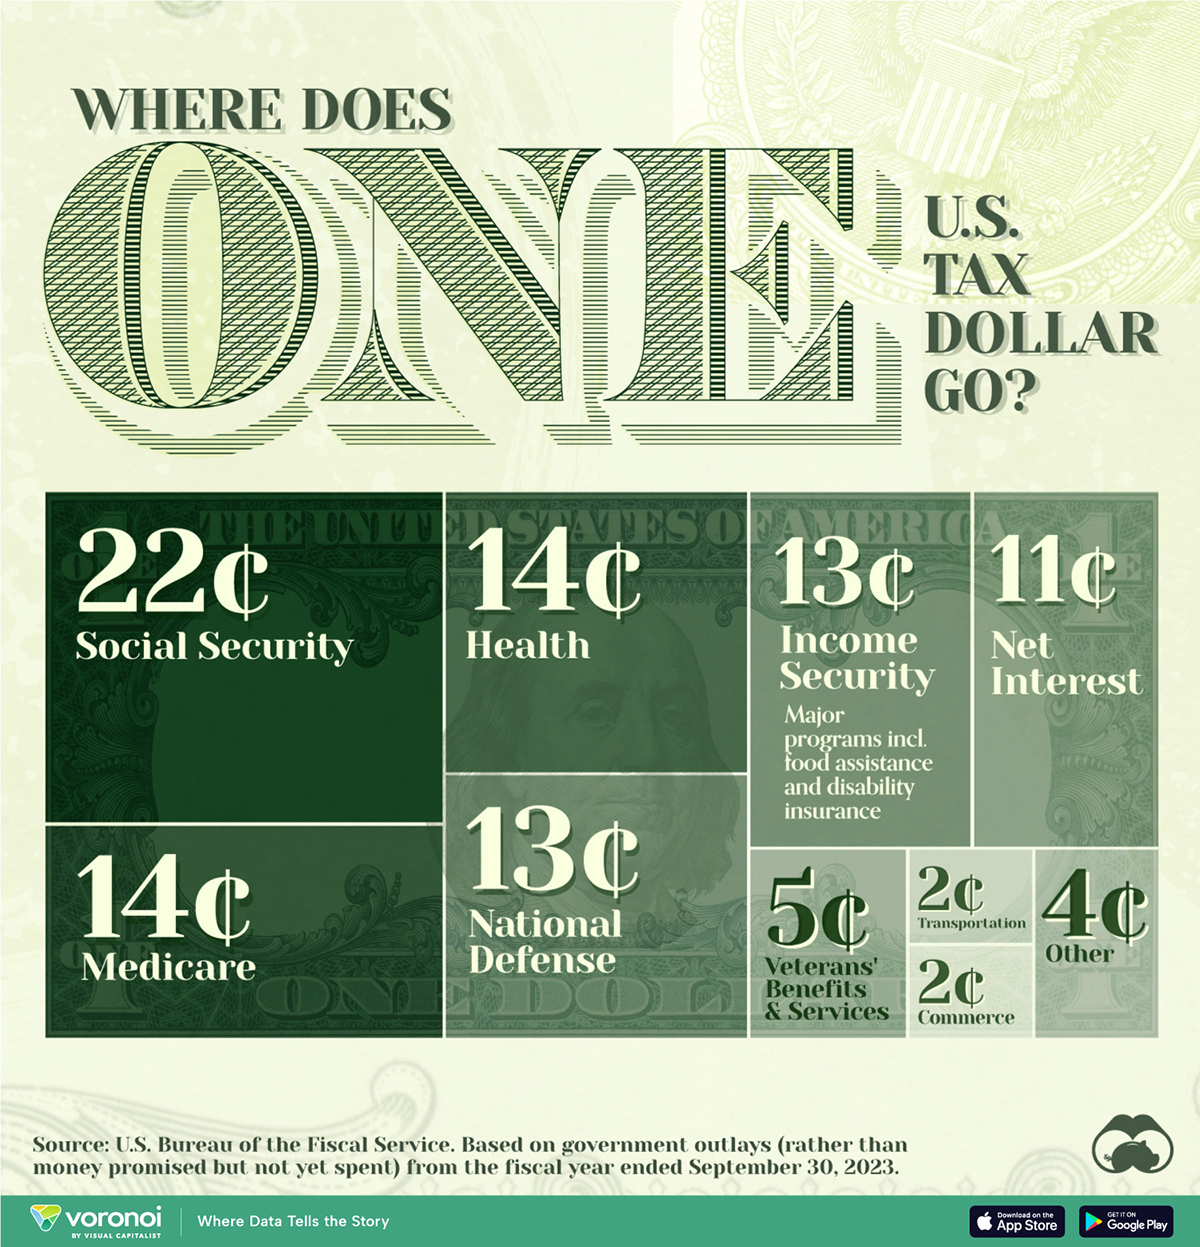
To answer that question, we visualized U.S. federal government spending by function, referencing expenditure to a single federal tax dollar.
Data is for the fiscal year ending September 30, 2023 from the U.S. Bureau of the Fiscal Service. Total spending amounts are converted to cents on the dollar and percentages, to show where one tax dollar goes.
Major Areas of U.S. Government Spending
Social security is the government’s single largest expense and where 22% of tax dollars go. Signed into law in 1935, the program was to insure against the “hazards and vicissitudes of life.” In practice, it meant the creation of a work-related contributory system in which workers secure their own retirement by taxes paid while employed.
However, an aging population threatens its sustainability because as more people retire and draw benefits, there are fewer active workers contributing to the system.
| Government Spending | Amount Paid Out of $1 Tax Dollar |
|---|---|
| 🏛️ Social Security | $0.22 |
| 🏥 Health | $0.14 |
| 🚑 Medicare | $0.14 |
| ⚔️ National Defense | $0.13 |
| 💰 Income Security | $0.13 |
| 📈 Net Interest | $0.11 |
| 🎖️ Veterans' Benefits & Services | $0.05 |
| 🚗 Transportation | $0.02 |
| 🛒 Commerce | $0.02 |
| 🔍 Other | $0.04 |
Health and Medicare together amount to 28% of government spending. The largest health expense is grants to states for Medicaid, which helps cover medical costs for people with lower incomes. Medicare, on the other hand, is federal health insurance for people 65 and older, as well as younger people with disabilities.
National Defense accounts for 13% of government spending. This includes paying military personnel, operating and maintenance costs like fuel, buying aircraft and ships, and research and development. While fourth in terms of percentage spending, this still contributes to the largest military budget in the world—by quite a margin.
Meanwhile, Income Security (also at 13%) covers programs like unemployment compensation, nutrition assistance, and housing assistance. It also has additional retirement and disability benefits not covered by social security.
Just behind—and still well-ahead of all other government spending—is Interest Payments on government debt, coming in at about 11% of tax supported expenditure.


Wealth
Charted: Which Country Has the Most Billionaires in 2024?
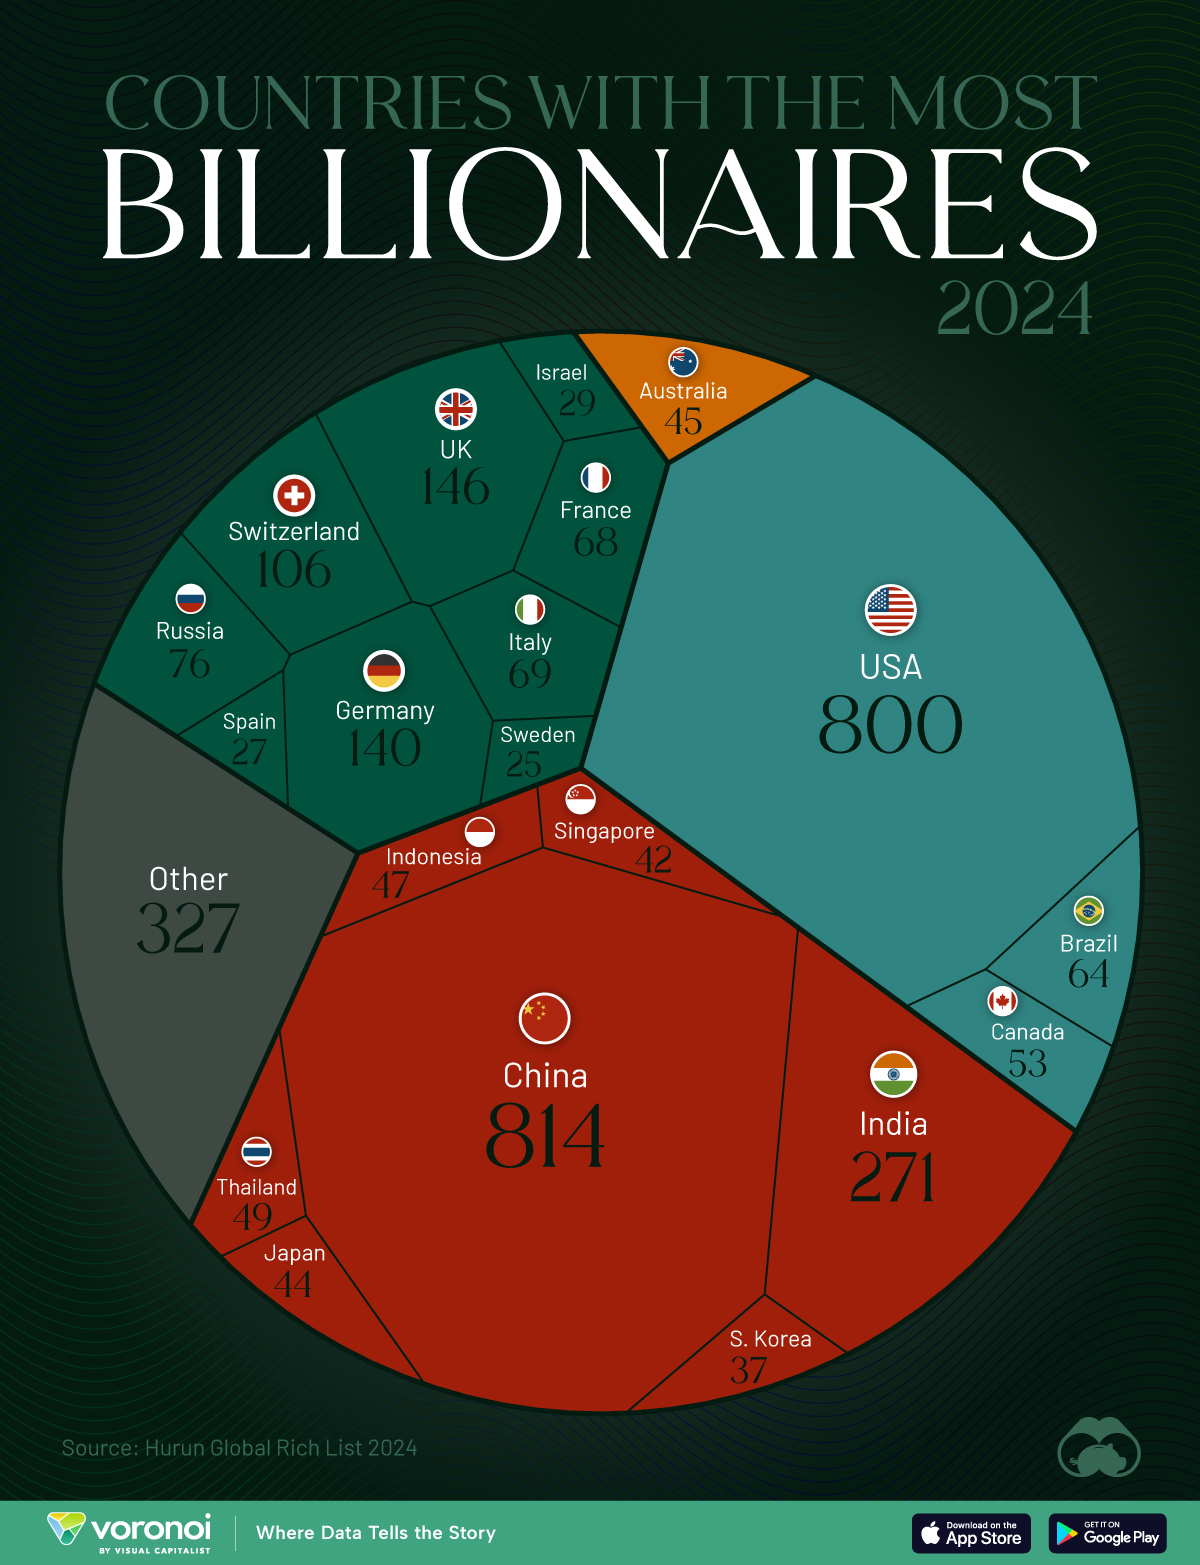
According to the annual Hurun Global Rich List, the U.S. and China are home to nearly half of the world’s 3,279 billionaires in 2024.
Charted: Which Country Has the Most Billionaires in 2024?
This was originally posted on our Voronoi app. Download the app for free on iOS or Android and discover incredible data-driven charts from a variety of trusted sources.
The world has always had people with incredible wealth: from Roman emperors to John D. Rockefeller who became the world’s first billionaire in measurable dollars. But where do the very wealthiest people live right now?
We visualize the countries with the most billionaires in 2024, sourced from the annual Hurun Global Rich list. A country and city aggregate is also available here.
A caveat to this data. Total wealth estimates are notoriously difficult to get right, and different sources can vary in their billionaire data. For example, Forbes, switches ranks for the U.S. and China, though the overall top three remain the same.
Forbes also has Bernard Arnault as the current richest individual, while Hurun places Elon Musk atop the ranks. Nevertheless, their overall top 10 is similar with a few ranking differences.
Ranked: Countries with the Most Billionaires in 2024
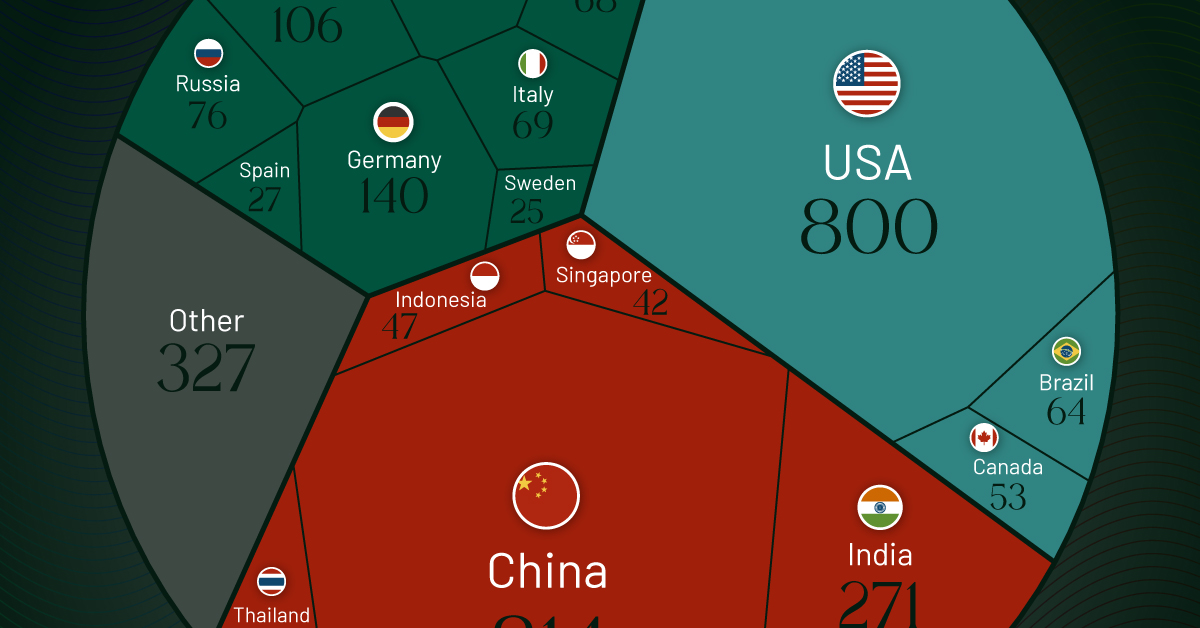
China has 814 billionaires, the most in the world, according to the Hurun Global Rich List 2024. Despite holding on to the top spot, China lost 155 billionaires year-over-year, while the U.S. gained 109. The gap between the two countries has now reduced to just 14 billionaires.
| Rank | Country | Billionaires | Change YoY |
|---|---|---|---|
| 1 | 🇨🇳 China | 814 | -155 |
| 2 | 🇺🇸 U.S. | 800 | +109 |
| 3 | 🇮🇳 India | 271 | +84 |
| 4 | 🇬🇧 UK | 146 | +12 |
| 5 | 🇩🇪 Germany | 140 | -4 |
| 6 | 🇨🇭 Switzerland | 106 | +6 |
| 7 | 🇷🇺 Russia | 76 | +6 |
| 8 | 🇮🇹 Italy | 69 | +11 |
| 9 | 🇫🇷 France | 68 | -4 |
| 10 | 🇧🇷 Brazil | 64 | +13 |
| 11 | 🇨🇦 Canada | 53 | +8 |
| 12 | 🇹🇭 Thailand | 49 | +3 |
| 13 | 🇮🇩 Indonesia | 47 | +12 |
| 14 | 🇦🇺 Australia | 45 | 0 |
| 15 | 🇯🇵 Japan | 44 | +12 |
| 16 | 🇸🇬 Singapore | 42 | +5 |
| 17 | 🇰🇷 South Korea | 37 | +4 |
| 18 | 🇮🇱 Israel | 29 | +9 |
| 19 | 🇪🇸 Spain | 27 | +1 |
| 20 | 🇸🇪 Sweden | 25 | -2 |
| N/A | 🌍 Other | 327 | N/A |
Together, the U.S. and China account for nearly half of the 3,279 billionaires globally, leagues ahead of closest peers, #3 India (271) and #4 UK (146).
Collectively however, European countries account for six of the top 10 and eight of the top 20 countries with the most billionaires.
Naturally, the world’s largest economies tend to be overrepresented on billionaire counts, as they provide more opportunities for wealth creation.
Switzerland, Singapore, and Sweden are outliers in this regard, with only one of them making the top 20 economies by total gross domestic product.
All three countries are perceived to have high tax rates, generally not conducive to amassing wealth. But perceptions can be misleading. Sweden, for example, has no inheritance tax, a flat rate on capital gains, and a corporate tax rate at 21%.

-

 Demographics6 days ago
The Countries That Have Become Sadder Since 2010
-

 Green2 weeks ago
Ranked: The Countries With the Most Air Pollution in 2023
-

 Green2 weeks ago
Ranking the Top 15 Countries by Carbon Tax Revenue
-

 Markets2 weeks ago
U.S. Debt Interest Payments Reach $1 Trillion
-

 Mining2 weeks ago
Gold vs. S&P 500: Which Has Grown More Over Five Years?
-

 Energy2 weeks ago
The World’s Biggest Nuclear Energy Producers
-

 Misc2 weeks ago
How Hard Is It to Get Into an Ivy League School?
-

 Debt2 weeks ago
How Debt-to-GDP Ratios Have Changed Since 2000