Money
Visualizing the Growth of $100, by Asset Class (1970-2023)
![]() See this visualization first on the Voronoi app.
See this visualization first on the Voronoi app.
Visualizing the Growth of $100, by Asset Class
This was originally posted on our Voronoi app. Download the app for free on iOS or Android and discover incredible data-driven charts from a variety of trusted sources.
Which major asset class has generated the strongest returns over the long run? How do the returns of investments like bonds and real estate actually stack up?
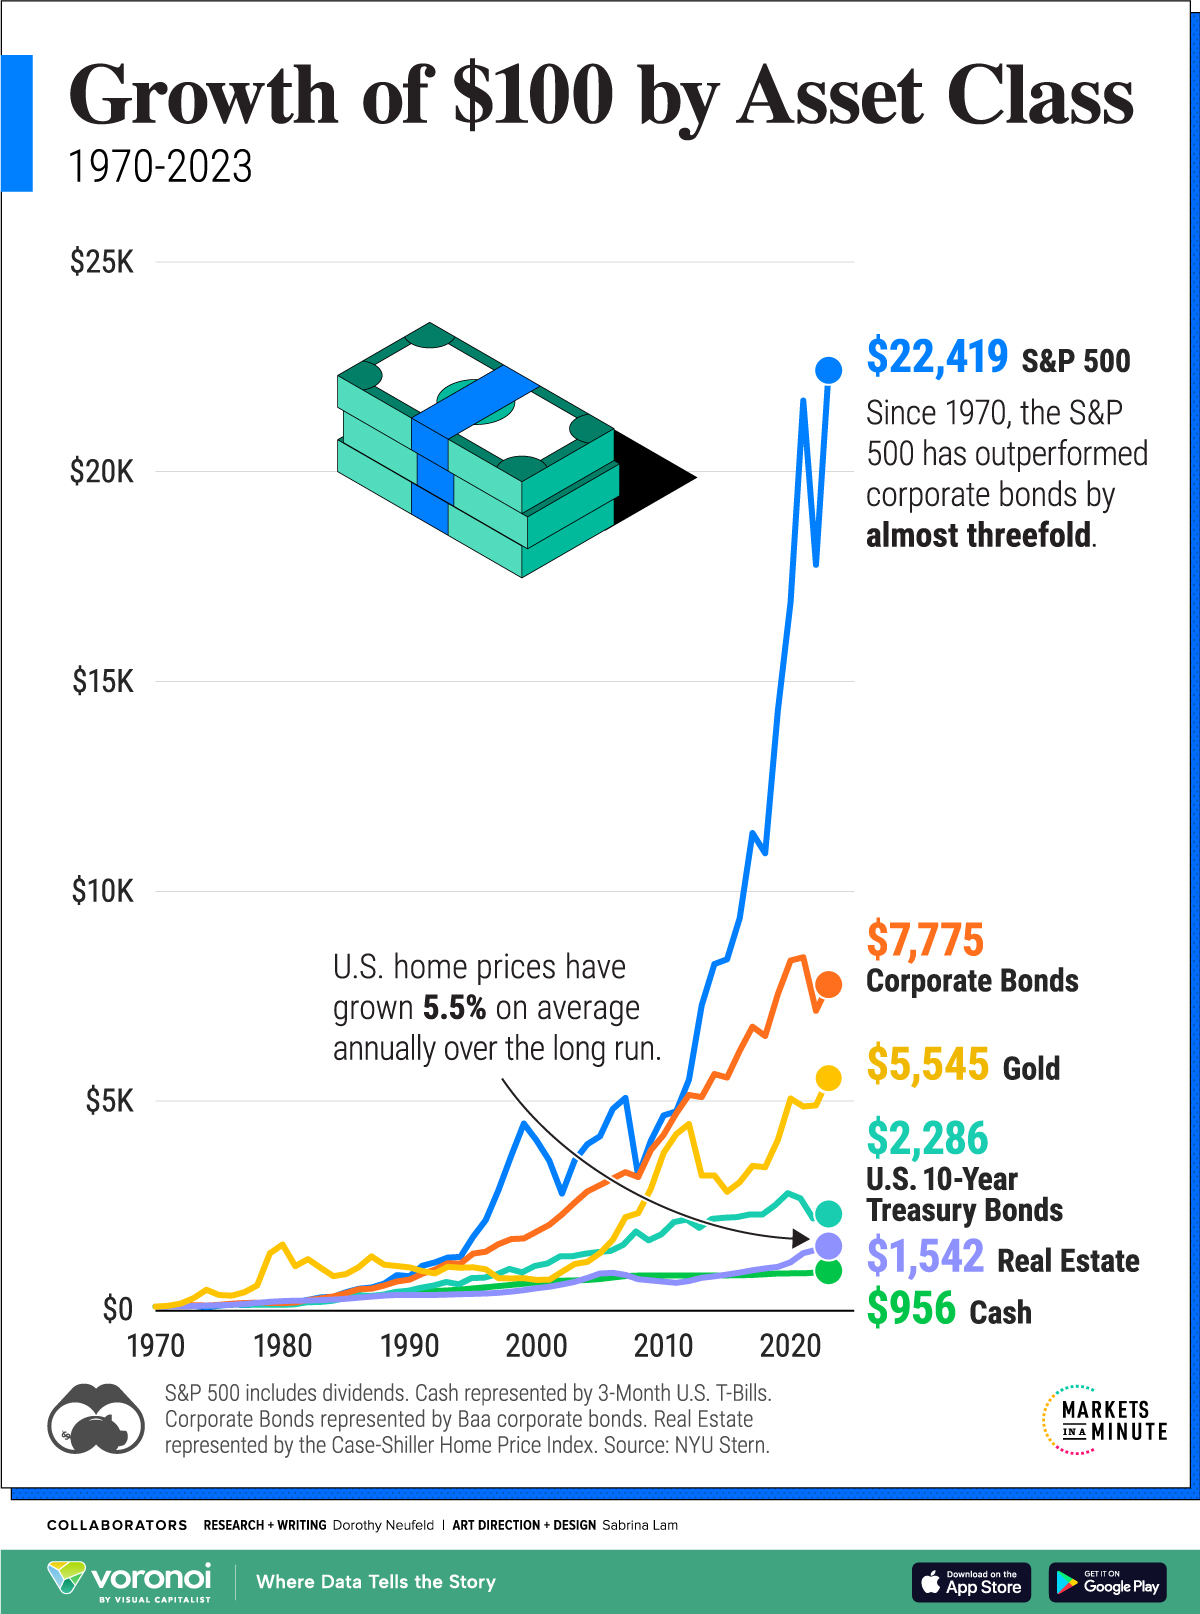
To put investment returns in perspective, this graphic shows the growth of $100 by asset class over the long term, based on data from Aswath Damodaran at NYU Stern.
Comparing Asset Class Returns
Below, we show the returns of a $100 investment across major asset classes—from U.S. stocks to gold—between 1970 and 2023:
| Year | S&P 500 | Corporate Bonds | Gold | U.S. 10-Year Treasury Bonds | Real Estate | Cash |
|---|---|---|---|---|---|---|
| 1970 | $100 | $100 | $100 | $100 | $100 | $100 |
| 1980 | $226 | $181 | $1,578 | $141 | $229 | $192 |
| 1990 | $823 | $741 | $1,033 | $477 | $374 | $431 |
| 2000 | $4,060 | $1,886 | $734 | $1,067 | $536 | $682 |
| 2010 | $4,656 | $4,191 | $3,760 | $1,821 | $693 | $840 |
| 2020 | $16,890 | $8,349 | $5,059 | $2,802 | $1,155 | $891 |
| 2023 | $22,419 | $7,775 | $5,545 | $2,286 | $1,542 | $956 |
Numbers have been rounded. S&P 500 includes dividends. Cash represented by 3-Month U.S. T-Bills. Corporate Bonds represented by Baa corporate bonds. Real Estate represented by the Case-Shiller Home Price Index.
As we can see, a $100 investment in the S&P 500 (including reinvested dividends) in 1970 would be worth an impressive $22,419 in 2023.
Not only were U.S. stocks the top performing major asset class, they outpaced other investments by a wide margin. Consider how a $100 investment in corporate bonds would have grown to $7,775 over the period, or 65% lower than an investment in the S&P 500.
When it comes to gold, a $100 investment would have been worth $5,545 by 2023. During the 1970s and 2000s, gold boomed amid bouts of inflation and a falling U.S. dollar. By comparison, the S&P 500 saw much lower returns over these decades.
Real estate, another safe haven asset, grew on average 5.5% annually since 1970, with the highest gains seen in the decade through 2020. It’s worth noting that these numbers are from the Case-Shiller Home Price Index, which is based on purely price changes over time.
Given that real estate is a unique asset class, this doesn’t necessarily illustrate the returns that homeowners actually receive, factoring in leverage, property taxes, insurance, and other expenses. From this price perspective, a $100 investment would have grown to just $1,542 by 2023 due to slower price growth through the 1980s and 2000s weighing on overall gains.
During both periods, the housing market crashed, taking years for the sector to fully recover. In fact, following the Global Financial Crisis, it took a decade for home prices to climb to their previous 2006 peak.


Wealth
Charted: Which Country Has the Most Billionaires in 2024?
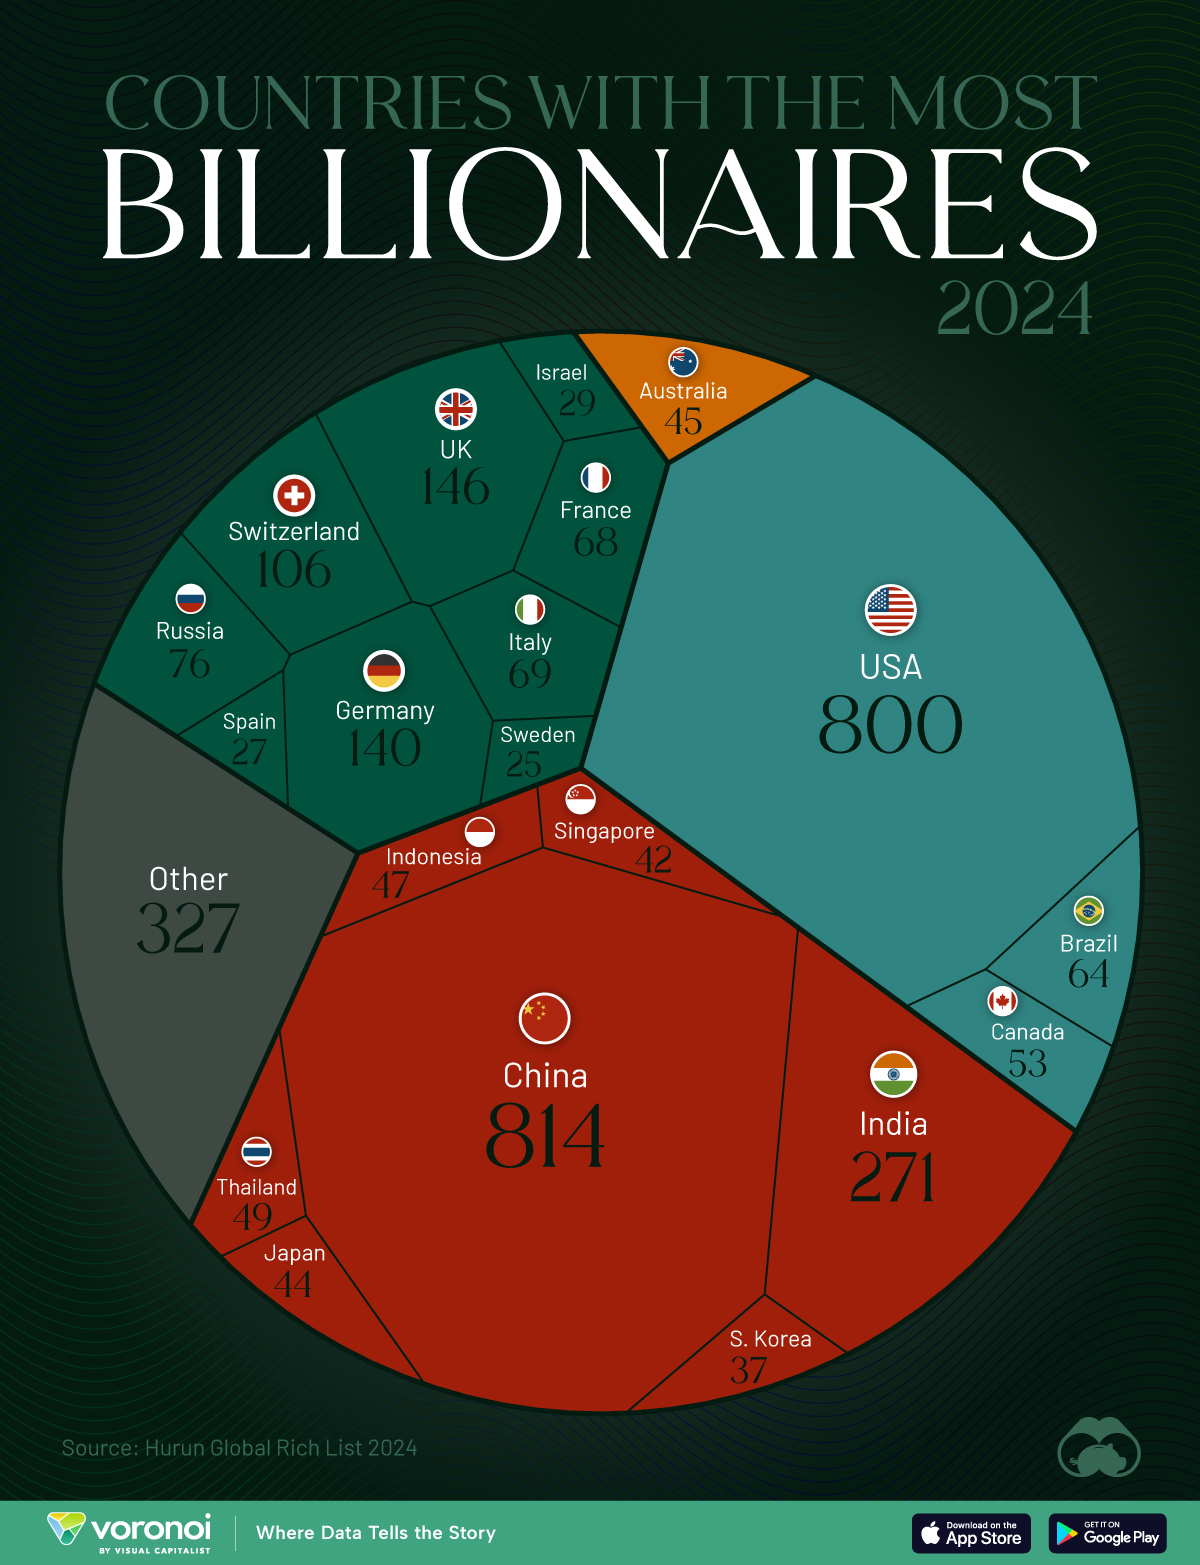
According to the annual Hurun Global Rich List, the U.S. and China are home to nearly half of the world’s 3,279 billionaires in 2024.
Charted: Which Country Has the Most Billionaires in 2024?
This was originally posted on our Voronoi app. Download the app for free on iOS or Android and discover incredible data-driven charts from a variety of trusted sources.
The world has always had people with incredible wealth: from Roman emperors to John D. Rockefeller who became the world’s first billionaire in measurable dollars. But where do the very wealthiest people live right now?
We visualize the countries with the most billionaires in 2024, sourced from the annual Hurun Global Rich list. A country and city aggregate is also available here.
A caveat to this data. Total wealth estimates are notoriously difficult to get right, and different sources can vary in their billionaire data. For example, Forbes, switches ranks for the U.S. and China, though the overall top three remain the same.
Forbes also has Bernard Arnault as the current richest individual, while Hurun places Elon Musk atop the ranks. Nevertheless, their overall top 10 is similar with a few ranking differences.
Ranked: Countries with the Most Billionaires in 2024
China has 814 billionaires, the most in the world, according to the Hurun Global Rich List 2024. Despite holding on to the top spot, China lost 155 billionaires year-over-year, while the U.S. gained 109. The gap between the two countries has now reduced to just 14 billionaires.
| Rank | Country | Billionaires | Change YoY |
|---|---|---|---|
| 1 | 🇨🇳 China | 814 | -155 |
| 2 | 🇺🇸 U.S. | 800 | +109 |
| 3 | 🇮🇳 India | 271 | +84 |
| 4 | 🇬🇧 UK | 146 | +12 |
| 5 | 🇩🇪 Germany | 140 | -4 |
| 6 | 🇨🇭 Switzerland | 106 | +6 |
| 7 | 🇷🇺 Russia | 76 | +6 |
| 8 | 🇮🇹 Italy | 69 | +11 |
| 9 | 🇫🇷 France | 68 | -4 |
| 10 | 🇧🇷 Brazil | 64 | +13 |
| 11 | 🇨🇦 Canada | 53 | +8 |
| 12 | 🇹🇭 Thailand | 49 | +3 |
| 13 | 🇮🇩 Indonesia | 47 | +12 |
| 14 | 🇦🇺 Australia | 45 | 0 |
| 15 | 🇯🇵 Japan | 44 | +12 |
| 16 | 🇸🇬 Singapore | 42 | +5 |
| 17 | 🇰🇷 South Korea | 37 | +4 |
| 18 | 🇮🇱 Israel | 29 | +9 |
| 19 | 🇪🇸 Spain | 27 | +1 |
| 20 | 🇸🇪 Sweden | 25 | -2 |
| N/A | 🌍 Other | 327 | N/A |
Together, the U.S. and China account for nearly half of the 3,279 billionaires globally, leagues ahead of closest peers, #3 India (271) and #4 UK (146).
Collectively however, European countries account for six of the top 10 and eight of the top 20 countries with the most billionaires.
Naturally, the world’s largest economies tend to be overrepresented on billionaire counts, as they provide more opportunities for wealth creation.
Switzerland, Singapore, and Sweden are outliers in this regard, with only one of them making the top 20 economies by total gross domestic product.
All three countries are perceived to have high tax rates, generally not conducive to amassing wealth. But perceptions can be misleading. Sweden, for example, has no inheritance tax, a flat rate on capital gains, and a corporate tax rate at 21%.

-

 Demographics6 days ago
The Countries That Have Become Sadder Since 2010
-

 Green2 weeks ago
Ranked: The Countries With the Most Air Pollution in 2023
-

 Green2 weeks ago
Ranking the Top 15 Countries by Carbon Tax Revenue
-

 Markets2 weeks ago
U.S. Debt Interest Payments Reach $1 Trillion
-

 Mining2 weeks ago
Gold vs. S&P 500: Which Has Grown More Over Five Years?
-

 Energy2 weeks ago
The World’s Biggest Nuclear Energy Producers
-

 Misc2 weeks ago
How Hard Is It to Get Into an Ivy League School?
-

 Debt2 weeks ago
How Debt-to-GDP Ratios Have Changed Since 2000