United States
Charted: U.S. Median House Prices vs. Income
![]() See this visualization first on the Voronoi app.
See this visualization first on the Voronoi app.
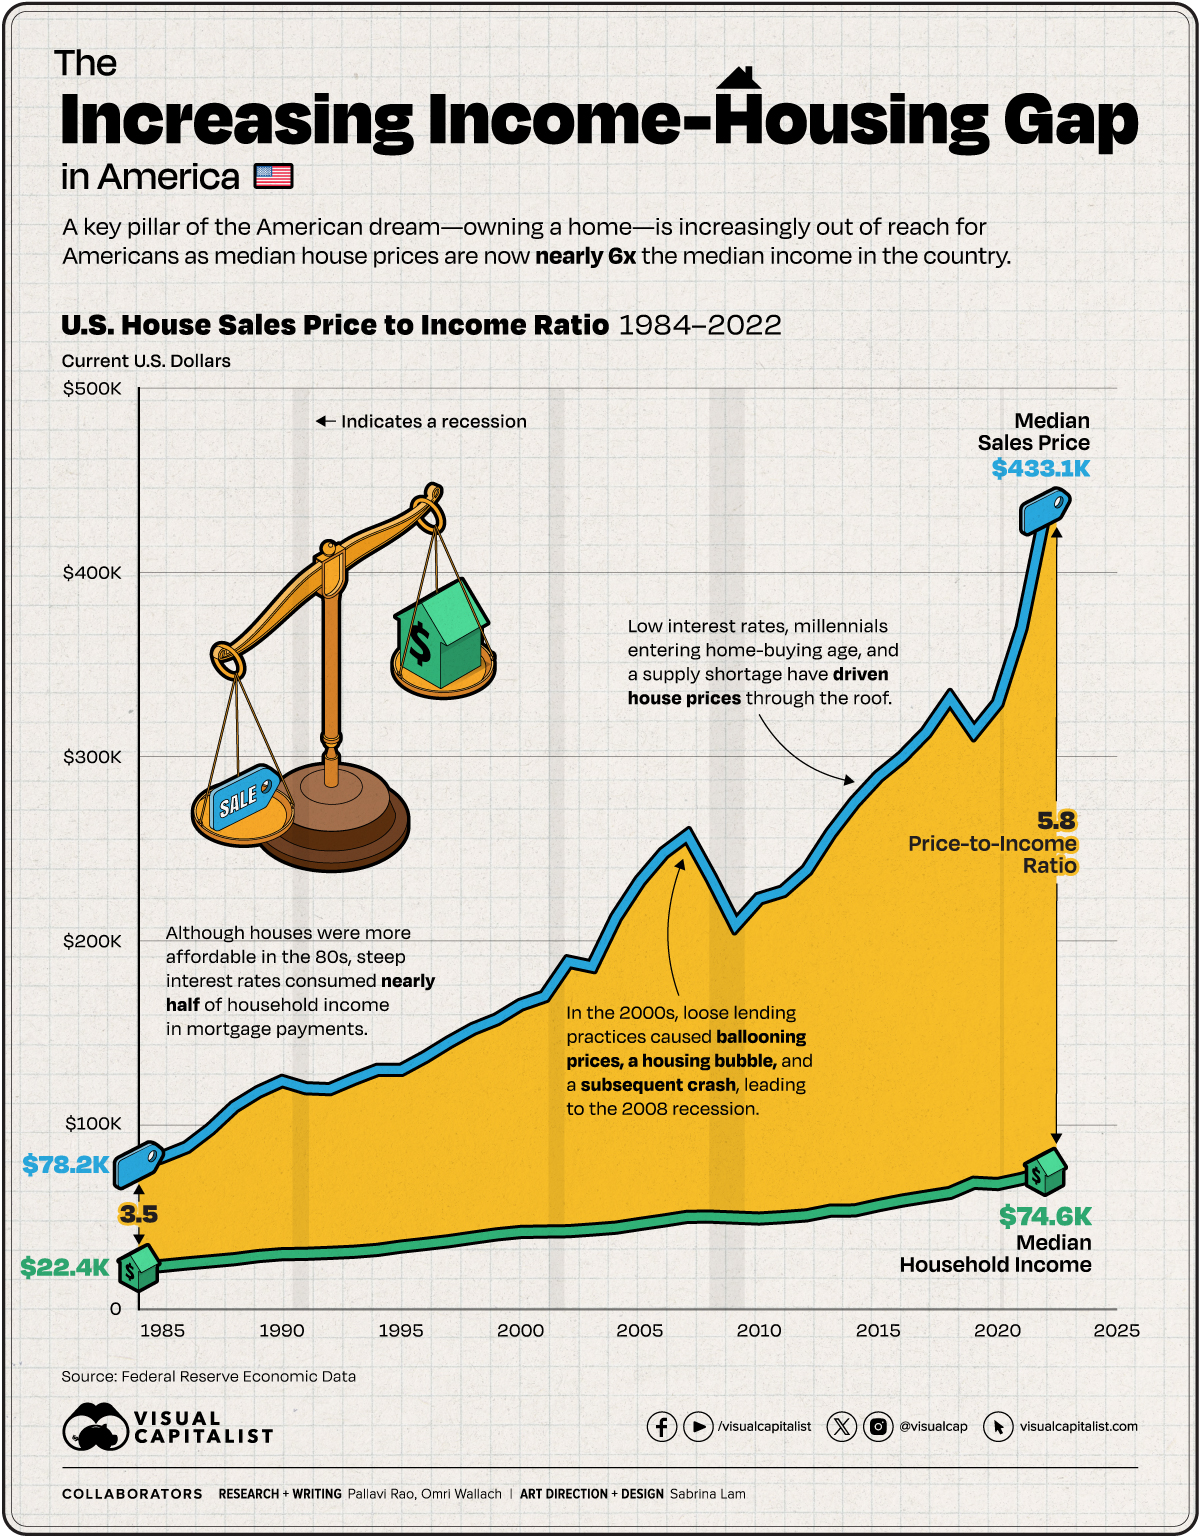
Houses in America Now Cost Six Times the Median Income
This was originally posted on our Voronoi app. Download the app for free on iOS or Android and discover incredible data-driven charts from a variety of trusted sources.
As of 2023, an American household hoping to buy a median-priced home, needs to make at least $100,000 a year. In some cities, they need to make nearly 3–4x that amount.
The median household income in the country is currently well below that $100,000 threshold. To look at the trends between median incomes and median house prices through the years, we charted their movement using the following datasets data from the Federal Reserve:
- Median household income (1984–2022).
- Median Sales Price of Houses Sold (1963–2023).
Importantly this graphic does not make allowances for actual household disposable income, nor how monthly mortgage payments change depending on the interest rates at the time. Finally, both datasets are in current U.S. dollars, meaning they are not adjusted for inflation.
Timeline: Median House Prices vs. Income in America
In 1984, the median annual income for an American household stood at $22,420, and the median house sales price for the first quarter of the year came in at $78,200. The house sales price-to-income ratio stood at 3.49.
By pure arithmetic, this is the most affordable houses have been in the U.S. since the Federal Reserve began tracking this data, as seen in the table below.
A hidden caveat of course, was inflation: running rampant towards the end of the 70s and the start of the 80s. While it fell significantly in the next five years, in 1984 the 30-year fixed rate was close to 14%, meaning a significant chunk of household income went to interest payments.
| Date | Median House Sales Price | Median Household Income | Price-to-Income Ratio |
|---|---|---|---|
| 1984-01-01 | $78,200 | $22,420 | 3.49 |
| 1985-01-01 | $82,800 | $23,620 | 3.51 |
| 1986-01-01 | $88,000 | $24,900 | 3.53 |
| 1987-01-01 | $97,900 | $26,060 | 3.76 |
| 1988-01-01 | $110,000 | $27,230 | 4.04 |
| 1989-01-01 | $118,000 | $28,910 | 4.08 |
| 1990-01-01 | $123,900 | $29,940 | 4.14 |
| 1991-01-01 | $120,000 | $30,130 | 3.98 |
| 1992-01-01 | $119,500 | $30,640 | 3.90 |
| 1993-01-01 | $125,000 | $31,240 | 4.00 |
| 1994-01-01 | $130,000 | $32,260 | 4.03 |
| 1995-01-01 | $130,000 | $34,080 | 3.81 |
| 1996-01-01 | $137,000 | $35,490 | 3.86 |
| 1997-01-01 | $145,000 | $37,010 | 3.92 |
| 1998-01-01 | $152,200 | $38,890 | 3.91 |
| 1999-01-01 | $157,400 | $40,700 | 3.87 |
| 2000-01-01 | $165,300 | $41,990 | 3.94 |
| 2001-01-01 | $169,800 | $42,230 | 4.02 |
| 2002-01-01 | $188,700 | $42,410 | 4.45 |
| 2003-01-01 | $186,000 | $43,320 | 4.29 |
| 2004-01-01 | $212,700 | $44,330 | 4.80 |
| 2005-01-01 | $232,500 | $46,330 | 5.02 |
| 2006-01-01 | $247,700 | $48,200 | 5.14 |
| 2007-01-01 | $257,400 | $50,230 | 5.12 |
| 2008-01-01 | $233,900 | $50,300 | 4.65 |
| 2009-01-01 | $208,400 | $49,780 | 4.19 |
| 2010-01-01 | $222,900 | $49,280 | 4.52 |
| 2011-01-01 | $226,900 | $50,050 | 4.53 |
| 2012-01-01 | $238,400 | $51,020 | 4.67 |
| 2013-01-01 | $258,400 | $53,590 | 4.82 |
| 2014-01-01 | $275,200 | $53,660 | 5.13 |
| 2015-01-01 | $289,200 | $56,520 | 5.12 |
| 2016-01-01 | $299,800 | $59,040 | 5.08 |
| 2017-01-01 | $313,100 | $61,140 | 5.12 |
| 2018-01-01 | $331,800 | $63,180 | 5.25 |
| 2019-01-01 | $313,000 | $68,700 | 4.56 |
| 2020-01-01 | $329,000 | $68,010 | 4.84 |
| 2021-01-01 | $369,800 | $70,780 | 5.22 |
| 2022-01-01 | $433,100 | $74,580 | 5.81 |
Note: The median house sale price listed in this table and in the chart is from the first quarter of each year. As a result the ratio can vary between quarters of each year.
The mid-2000s witnessed an explosive surge in home prices, eventually culminating in a housing bubble and subsequent crash—an influential factor in the 2008 recession. Subprime mortgages played a pivotal role in this scenario, as they were issued to buyers with poor credit and then bundled into seemingly more attractive securities for financial institutions. However, these loans eventually faltered as economic circumstances changed.
In response to the recession and to stimulate economic demand, the Federal Reserve reduced interest rates, consequently lowering mortgage rates.
While this measure aimed to make homeownership more accessible, it also contributed to a significant increase in housing prices in the following years. Additionally, a new generation entering the home-buying market heightened demand. Simultaneously, a scarcity of new construction and a surge in investors and corporations converting housing units into rental properties led to a shortage in supply, exerting upward pressure on prices.
As a result, median house prices are now nearly 6x the median household income in America.
How Does Unaffordable Housing Affect the U.S. Economy?
When housing costs exceed a significant portion of household income, families are forced to cut back on other essential expenditures, dampening consumer spending. Given how expanding housing supply helped drive U.S. economic growth in the 20th century, the current constraints in the country are especially ironic.
Unaffordable housing also stifles mobility, as individuals may be reluctant to relocate for better job opportunities due to housing constraints. On the flip side, many cities are seeing severe labor shortages as many lower-wage workers simply cannot afford to live in the city. Both phenomena affect market efficiency and productivity growth.


United States
Ranked: The Largest U.S. Corporations by Number of Employees
We visualized the top U.S. companies by employees, revealing the massive scale of retailers like Walmart, Target, and Home Depot.


The Largest U.S. Corporations by Number of Employees
This was originally posted on our Voronoi app. Download the app for free on Apple or Android and discover incredible data-driven charts from a variety of trusted sources.
Revenue and profit are common measures for measuring the size of a business, but what about employee headcount?
To see how big companies have become from a human perspective, we’ve visualized the top U.S. companies by employees. These figures come from companiesmarketcap.com, and were accessed in March 2024. Note that this ranking includes publicly-traded companies only.
Data and Highlights
The data we used to create this list of largest U.S. corporations by number of employees can be found in the table below.
| Company | Sector | Number of Employees |
|---|---|---|
| Walmart | Consumer Staples | 2,100,000 |
| Amazon | Consumer Discretionary | 1,500,000 |
| UPS | Industrials | 500,000 |
| Home Depot | Consumer Discretionary | 470,000 |
| Concentrix | Information Technology | 440,000 |
| Target | Consumer Staples | 440,000 |
| Kroger | Consumer Staples | 430,000 |
| UnitedHealth | Health Care | 400,000 |
| Berkshire Hathaway | Financials | 383,000 |
| Starbucks | Consumer Discretionary | 381,000 |
| Marriott International | Consumer Discretionary | 377,000 |
| Cognizant | Information Technology | 346,600 |
Retail and Logistics Top the List
Companies like Walmart, Target, and Kroger have a massive headcount due to having many locations spread across the country, which require everything from cashiers to IT professionals.
Moving goods around the world is also highly labor intensive, explaining why UPS has half a million employees globally.
Below the Radar?
Two companies that rank among the largest U.S. corporations by employees which may be less familiar to the public include Concentrix and Cognizant. Both of these companies are B2B brands, meaning they primarily work with other companies rather than consumers. This contrasts with brands like Amazon or Home Depot, which are much more visible among average consumers.
A Note on Berkshire Hathaway
Warren Buffett’s company doesn’t directly employ 383,000 people. This headcount actually includes the employees of the firm’s many subsidiaries, such as GEICO (insurance), Dairy Queen (retail), and Duracell (batteries).
If you’re curious to see how Buffett’s empire has grown over the years, check out this animated graphic that visualizes the growth of Berkshire Hathaway’s portfolio from 1994 to 2022.

-

 Education1 week ago
How Hard Is It to Get Into an Ivy League School?
-

 Technology2 weeks ago
Ranked: Semiconductor Companies by Industry Revenue Share
-

 Markets2 weeks ago
Ranked: The World’s Top Flight Routes, by Revenue
-

 Demographics2 weeks ago
Population Projections: The World’s 6 Largest Countries in 2075
-

 Markets2 weeks ago
The Top 10 States by Real GDP Growth in 2023
-

 Demographics2 weeks ago
The Smallest Gender Wage Gaps in OECD Countries
-

 Economy2 weeks ago
Where U.S. Inflation Hit the Hardest in March 2024
-

 Environment2 weeks ago
Top Countries By Forest Growth Since 2001