Personal Finance
Charted: Top 10 Retirement Planning Mistakes
![]() See this visualization first on the Voronoi app.
See this visualization first on the Voronoi app.
Top 10 Retirement Planning Mistakes
This was originally posted on our Voronoi app. Download the app for free on iOS or Android and discover incredible data-driven charts from a variety of trusted sources.
When planning financially for the future, what are the most common retirement planning mistakes people make?
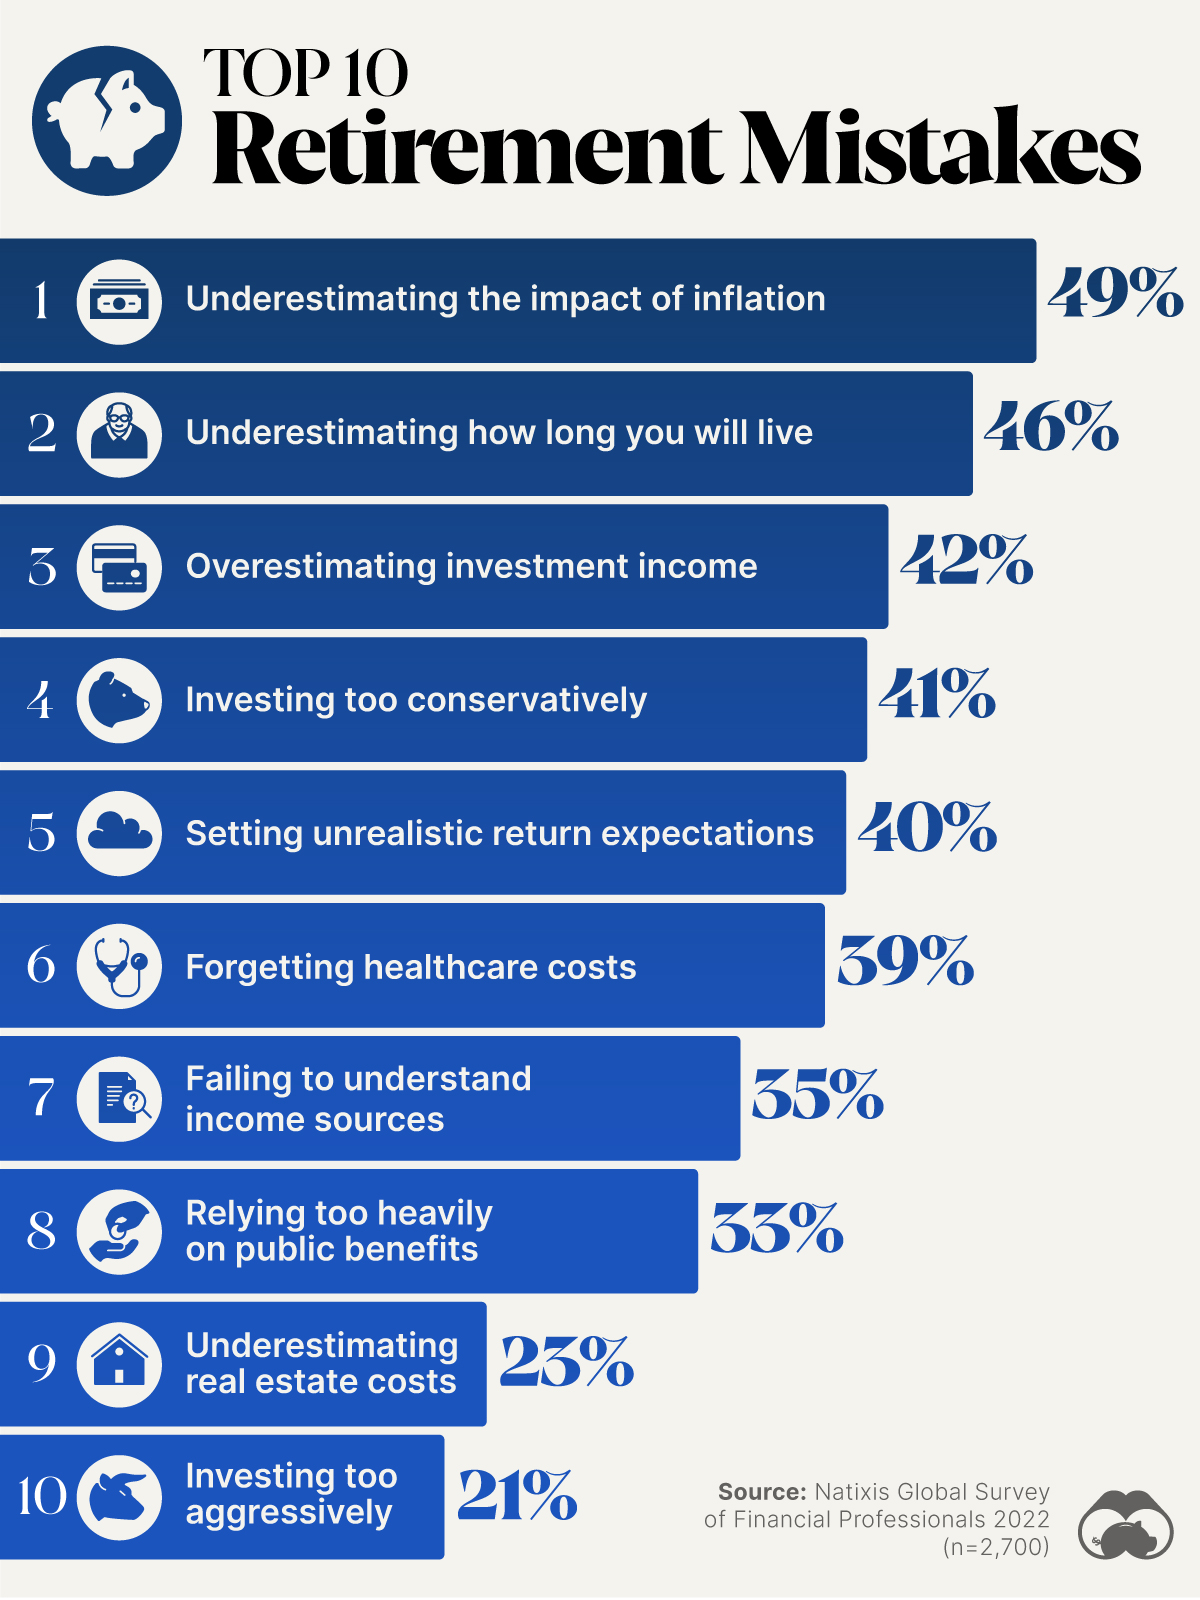
This chart uses data from the 2022 Natixis Global Survey, which polled 2,700 financial professionals across 16 countries between March and April 2022.
Most Common Retirement Mistakes
According to professionals, the most common retirement planning mistakes are time-related, like outliving savings or not understanding how inflation can affect a portfolio over time.
The number one mistake? According to 49% of financial planners, it’s underestimating the sizable impact inflation has on the value of retirement savings.
| Rank | Most Common Mistakes | Share |
|---|---|---|
| 1 | Underestimating the impact of inflation | 49% |
| 2 | Underestimating how long you will live | 46% |
| 3 | Overestimating investment income | 42% |
| 4 | Investing too conservatively | 41% |
| 5 | Setting unrealistic return expectations | 40% |
| 6 | Forgetting healthcare costs | 39% |
| 7 | Failing to understand income sources | 35% |
| 8 | Relying too heavily on public benefits | 33% |
| 9 | Underestimating real estate costs | 23% |
| 10 | Investing too aggressively | 21% |
Meanwhile, 46% of advisors see the underestimating of life spans as the second-most-common retirement mistake. The longer you live, the more retirement savings you’ll need to supplant income. And that’s not including the healthcare costs associated with aging, which 39% of advisors point out as another common retirement planning mistake.
Most of the other top retirement mistakes revolve around investment planning, including overestimating investment income (42%), investing too conservatively (41%), and setting unrealistic return expectations (40%).
On the flip side, 21% of retirees invest too aggressively according to financial professionals. While investing aggressively can be extremely beneficial especially in one’s earlier years, it can cause big problems later in life. That’s because later on, retirees need liquidity and must have access to their savings to cover life expenses. If a portfolio is volatile or not diversified, it may be hard to make up any short-term or sudden losses.


Personal Finance
Chart: The Declining Value of the U.S. Federal Minimum Wage
This graphic compares the nominal vs. inflation-adjusted value of the U.S. minimum wage, from 1940 to 2023.


The Declining Value of the U.S. Federal Minimum Wage
This was originally posted on our Voronoi app. Download the app for free on iOS or Android and discover incredible data-driven charts from a variety of trusted sources.
This graphic illustrates the history of the U.S. federal minimum wage using data compiled by Statista, in both nominal and real (inflation-adjusted) terms. The federal minimum wage was raised to $7.25 per hour in July 2009, where it has remained ever since.
Nominal vs. Real Value
The data we used to create this graphic can be found in the table below.
| Year | Nominal value ($/hour) | Real value ($/hour) |
|---|---|---|
| 1940 | 0.3 | 6.5 |
| 1945 | 0.4 | 6.82 |
| 1950 | 0.75 | 9.64 |
| 1955 | 0.75 | 8.52 |
| 1960 | 1 | 10.28 |
| 1965 | 1.25 | 12.08 |
| 1970 | 1.6 | 12.61 |
| 1975 | 2.1 | 12.04 |
| 1980 | 3.1 | 11.61 |
| 1985 | 3.35 | 9.51 |
| 1990 | 3.8 | 8.94 |
| 1995 | 4.25 | 8.49 |
| 2000 | 5.15 | 9.12 |
| 2005 | 5.15 | 8.03 |
| 2010 | 7.25 | 10.09 |
| 2015 | 7.25 | 9.3 |
| 2018 | 7.25 | 8.78 |
| 2019 | 7.25 | 8.61 |
| 2020 | 7.25 | 8.58 |
| 2021 | 7.25 | 8.24 |
| 2022 | 7.25 | 7.61 |
| 2023 | 7.25 | 7.25 |
What our graphic shows is how inflation has eroded the real value of the U.S. minimum wage over time, despite nominal increases.
For instance, consider the year 1960, when the federal minimum wage was $1 per hour. After accounting for inflation, this would be worth around $10.28 today!
The two lines converge at 2023 because the nominal and real value are identical in present day terms.
Many States Have Their Own Minimum Wage
According to the National Conference of State Legislatures (NCSL), 30 states and Washington, D.C. have implemented a minimum wage that is higher than $7.25.
The following states have adopted the federal minimum: Georgia, Idaho, Indiana, Iowa, Kansas, Kentucky, New Hampshire, North Carolina, North Dakota, Oklahoma, Pennsylvania, Texas, Utah, Wisconsin, and Wyoming.
Meanwhile, the states of Alabama, Louisiana, Mississippi, South Carolina, and Tennessee have no wage minimums, but have to follow the federal minimum.
How Does the U.S. Minimum Wage Rank Globally?
If you found this topic interesting, check out Mapped: Minimum Wage Around the World to see which countries have the highest minimum wage in monthly terms, as of January 2023.

-

 Culture1 week ago
The Highest Earning Athletes in Seven Professional Sports
-

 Countries2 weeks ago
Population Projections: The World’s 6 Largest Countries in 2075
-

 Markets2 weeks ago
The Top 10 States by Real GDP Growth in 2023
-

 Demographics2 weeks ago
The Smallest Gender Wage Gaps in OECD Countries
-

 Economy2 weeks ago
Where U.S. Inflation Hit the Hardest in March 2024
-

 Green2 weeks ago
Top Countries By Forest Growth Since 2001
-

 United States2 weeks ago
Ranked: The Largest U.S. Corporations by Number of Employees
-

 Maps2 weeks ago
The Largest Earthquakes in the New York Area (1970-2024)