Personal Finance
Mapped: Minimum Wage Around the World
Mapped: Minimum Wage Around the World
The purpose of a minimum wage is to establish a baseline income level for workers in a given jurisdiction. Ideally it’s enough to cover basic needs like food and housing, but this isn’t always a guarantee.
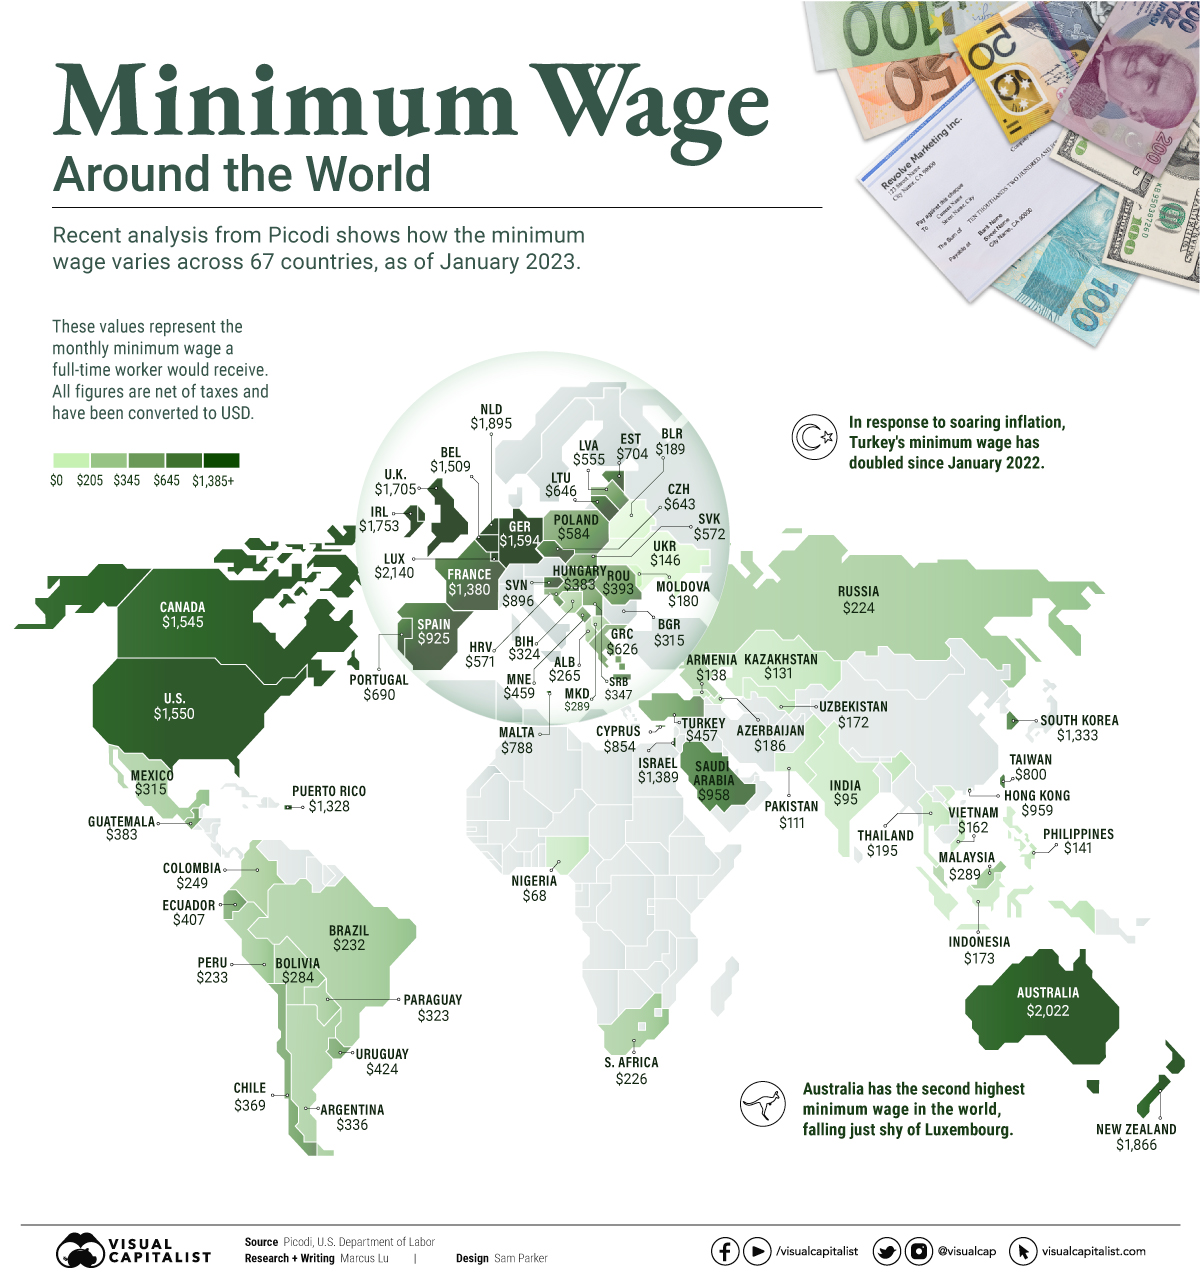
To see how the minimum wage differs around the world, we’ve visualized data from Picodi, which includes values for 67 countries as of January 2023.
Monthly Minimum Wage, by Country
The following table includes all of the data used in this infographic.
Each value represents the monthly minimum wage a full-time worker would receive in each country. Picodi states that these figures are net of taxes and have been converted to USD.
| Country | Increase compared to Jan 2022 | Minimum wage as of Jan 2023 (full-time, USD) |
|---|---|---|
| Argentina | 104.5% | $336 |
| Turkey | 100.0% | $457 |
| Moldova | 32.5% | $180 |
| Latvia | 27.1% | $555 |
| Malaysia | 25.8% | $289 |
| Pakistan | 24.6% | $111 |
| Romania | 24.5% | $393 |
| Germany | 21.9% | $1,594 |
| Belarus | 21.2% | $189 |
| Lithuania | 18.8% | $646 |
| North Macedonia | 18.5% | $298 |
| Mexico | 17.4% | $315 |
| Chile | 17.1% | $369 |
| Russia | 16.9% | $224 |
| Kazakhstan | 16.6% | $131 |
| Colombia | 16.4% | $249 |
| Hungary | 16.0% | $383 |
| Netherlands | 15.3% | $1,895 |
| Poland | 14.6% | $584 |
| Belgium | 14.3% | $1,509 |
| Serbia | 14.3% | $347 |
| Estonia | 14.2% | $704 |
| Azerbaijan | 14.2% | $186 |
| Albania | 13.3% | $265 |
| Slovenia | 12.9% | $896 |
| US | 12.6% | $1,550 |
| Croatia | 12.0% | $571 |
| Uzbekistan | 11.9% | $72 |
| Paraguay | 11.4% | $323 |
| Armenia | 11.4% | $138 |
| Peru | 10.3% | $233 |
| Bosnia and Herzegovina | 10.0% | $324 |
| Bulgaria | 9.9% | $315 |
| Luxembourg | 9.3% | $2,140 |
| Philippines | 9.2% | $141 |
| Uruguay | 9.0% | $424 |
| Brazil | 8.9% | $232 |
| India | 8.5% | $95 |
| Indonesia | 8.1% | $173 |
| Greece | 7.9% | $626 |
| Portugal | 7.8% | $690 |
| UK | 7.3% | $1,705 |
| Slovakia | 7.2% | $572 |
| South Africa | 6.9% | $226 |
| France | 6.6% | $1,380 |
| Czechia | 6.6% | $643 |
| Vietnam | 6.0% | $162 |
| Ecuador | 5.7% | $407 |
| New Zealand | 5.6% | $1,866 |
| Ireland | 5.4% | $1,753 |
| Canada | 5.1% | $1,545 |
| Thailand | 5.0% | $195 |
| Australia | 4.8% | $2,022 |
| South Korea | 4.7% | $1,333 |
| Taiwan | 4.6% | $800 |
| Bolivia | 4.0% | $284 |
| Guatemala | 3.9% | $383 |
| Malta | 3.6% | $788 |
| Ukraine | 3.1% | $146 |
| Israel | 0.0% | $1,389 |
| Puerto Rico | 0.0% | $1,328 |
| Hong Kong | 0.0% | $959 |
| Saudi Arabia | 0.0% | $958 |
| Spain | 0.0% | $925 |
| Montenegro | 0.0% | $459 |
| Nigeria | 0.0% | $68 |
| Cyprus | -- | $854 |
Generally speaking, developed countries have a higher cost of living, and thus require a higher minimum wage.
Two outliers in this dataset are Argentina and Turkey, which have increased their minimum wages by 100% or more from January 2022 levels.
Turkey is suffering from an ongoing currency crisis, with the lira losing over 40% of its value in 2021. Prices of basic goods have increased considerably as the Turkish lira continues to plummet. In fact, a 2022 survey found that 70% of people in Turkey were struggling to pay for food.
Argentina, South America’s second-biggest economy, is also suffering from very high inflation. In response, the country announced three minimum wage increases throughout 2022.
Minimum Wage in the U.S.
Within the U.S., minimum wage varies significantly by state. We’ve visualized each state’s basic minimum rate (hourly) using January 2023 data from the U.S. Department of Labor.

2023-03-17 Update: This map was updated to fix several incorrect values. We apologize for any confusion this may have caused.
America’s federal minimum wage has remained unchanged since 2009 at $7.25 per hour.
Each state is allowed to set their own minimum wage, as long as it’s higher than the federal minimum. In states that do not set their own minimum, the federal minimum applies.
If we assume someone works 40 hours a week, the federal minimum wage of $7.25 translates to an annual figure of just $15,080 before taxes. California’s minimum wage of $15.50 translates to $32,240 before taxes.
For further perspective, check out our 2022 infographic on the salary needed to buy a home across 50 U.S. cities.


Personal Finance
Chart: The Declining Value of the U.S. Federal Minimum Wage
This graphic compares the nominal vs. inflation-adjusted value of the U.S. minimum wage, from 1940 to 2023.


The Declining Value of the U.S. Federal Minimum Wage
This was originally posted on our Voronoi app. Download the app for free on iOS or Android and discover incredible data-driven charts from a variety of trusted sources.
This graphic illustrates the history of the U.S. federal minimum wage using data compiled by Statista, in both nominal and real (inflation-adjusted) terms. The federal minimum wage was raised to $7.25 per hour in July 2009, where it has remained ever since.
Nominal vs. Real Value
The data we used to create this graphic can be found in the table below.
| Year | Nominal value ($/hour) | Real value ($/hour) |
|---|---|---|
| 1940 | 0.3 | 6.5 |
| 1945 | 0.4 | 6.82 |
| 1950 | 0.75 | 9.64 |
| 1955 | 0.75 | 8.52 |
| 1960 | 1 | 10.28 |
| 1965 | 1.25 | 12.08 |
| 1970 | 1.6 | 12.61 |
| 1975 | 2.1 | 12.04 |
| 1980 | 3.1 | 11.61 |
| 1985 | 3.35 | 9.51 |
| 1990 | 3.8 | 8.94 |
| 1995 | 4.25 | 8.49 |
| 2000 | 5.15 | 9.12 |
| 2005 | 5.15 | 8.03 |
| 2010 | 7.25 | 10.09 |
| 2015 | 7.25 | 9.3 |
| 2018 | 7.25 | 8.78 |
| 2019 | 7.25 | 8.61 |
| 2020 | 7.25 | 8.58 |
| 2021 | 7.25 | 8.24 |
| 2022 | 7.25 | 7.61 |
| 2023 | 7.25 | 7.25 |
What our graphic shows is how inflation has eroded the real value of the U.S. minimum wage over time, despite nominal increases.
For instance, consider the year 1960, when the federal minimum wage was $1 per hour. After accounting for inflation, this would be worth around $10.28 today!
The two lines converge at 2023 because the nominal and real value are identical in present day terms.
Many States Have Their Own Minimum Wage
According to the National Conference of State Legislatures (NCSL), 30 states and Washington, D.C. have implemented a minimum wage that is higher than $7.25.
The following states have adopted the federal minimum: Georgia, Idaho, Indiana, Iowa, Kansas, Kentucky, New Hampshire, North Carolina, North Dakota, Oklahoma, Pennsylvania, Texas, Utah, Wisconsin, and Wyoming.
Meanwhile, the states of Alabama, Louisiana, Mississippi, South Carolina, and Tennessee have no wage minimums, but have to follow the federal minimum.
How Does the U.S. Minimum Wage Rank Globally?
If you found this topic interesting, check out Mapped: Minimum Wage Around the World to see which countries have the highest minimum wage in monthly terms, as of January 2023.

-

 Misc1 week ago
How Hard Is It to Get Into an Ivy League School?
-

 Technology2 weeks ago
Ranked: Semiconductor Companies by Industry Revenue Share
-

 Markets2 weeks ago
Ranked: The World’s Top Flight Routes, by Revenue
-

 Countries2 weeks ago
Population Projections: The World’s 6 Largest Countries in 2075
-

 Markets2 weeks ago
The Top 10 States by Real GDP Growth in 2023
-

 Demographics2 weeks ago
The Smallest Gender Wage Gaps in OECD Countries
-

 Economy2 weeks ago
Where U.S. Inflation Hit the Hardest in March 2024
-

 Environment2 weeks ago
Top Countries By Forest Growth Since 2001