

We visualized product categories that saw the highest % increase in price due to U.S. inflation as of March 2024.


We visualize inflation rates across G20 countries as of Feb 2024, in the context of their COVID-19 pandemic peak.


This visualization looks at how past interest rate cut cycles have gone and the rate cut forecasts by top institutions for 2024.
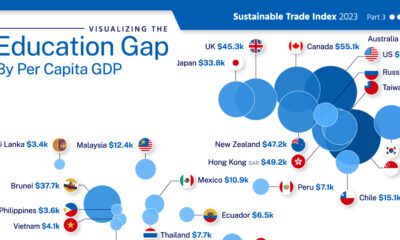

This graphic adds visual context to the global education gap, using data from 29 major economies.
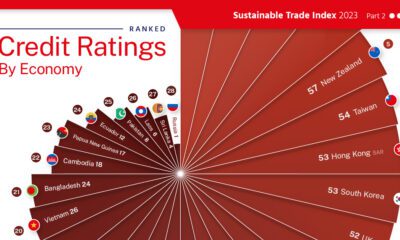

This graphic visualizes 30 country's credit ratings, using data from the 2023 Sustainable Trade Index.
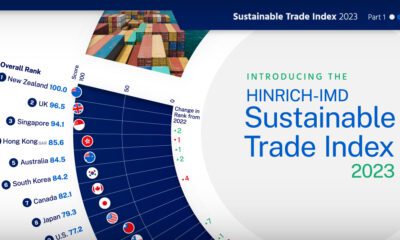

The Sustainable Trade Index 2023 is an annual ranking of the world's most sustainable economies. View this infographic to see the results.


The global middle class is expected to grow by 113 million people in 2024. We visualize this growth by country and region.
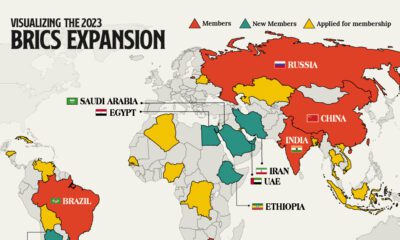

We provide a data-driven overview of how the recent BRICS expansion will grow the group’s influence and reach.
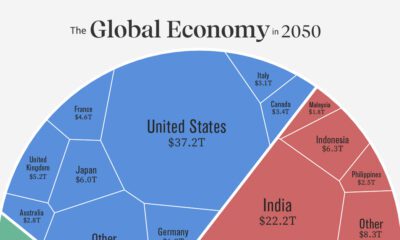

Asia is expected to represent the world's largest share of real GDP in 2050. See how this all breaks down in one chart.
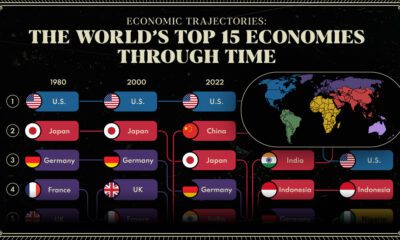

We provide a historical and predictive overview of the top economies in the world, including projections all the way to 2075.


