Personal Finance
Mapped: The Salary You Need to Buy a Home in 50 U.S. Cities
Check out the latest 2023 update of the salary needed to buy a home in the U.S.


This is the Salary You Need to Buy a Home in 50 U.S. Cities
Check out the latest 2023 update of the salary needed to buy a home in the U.S.
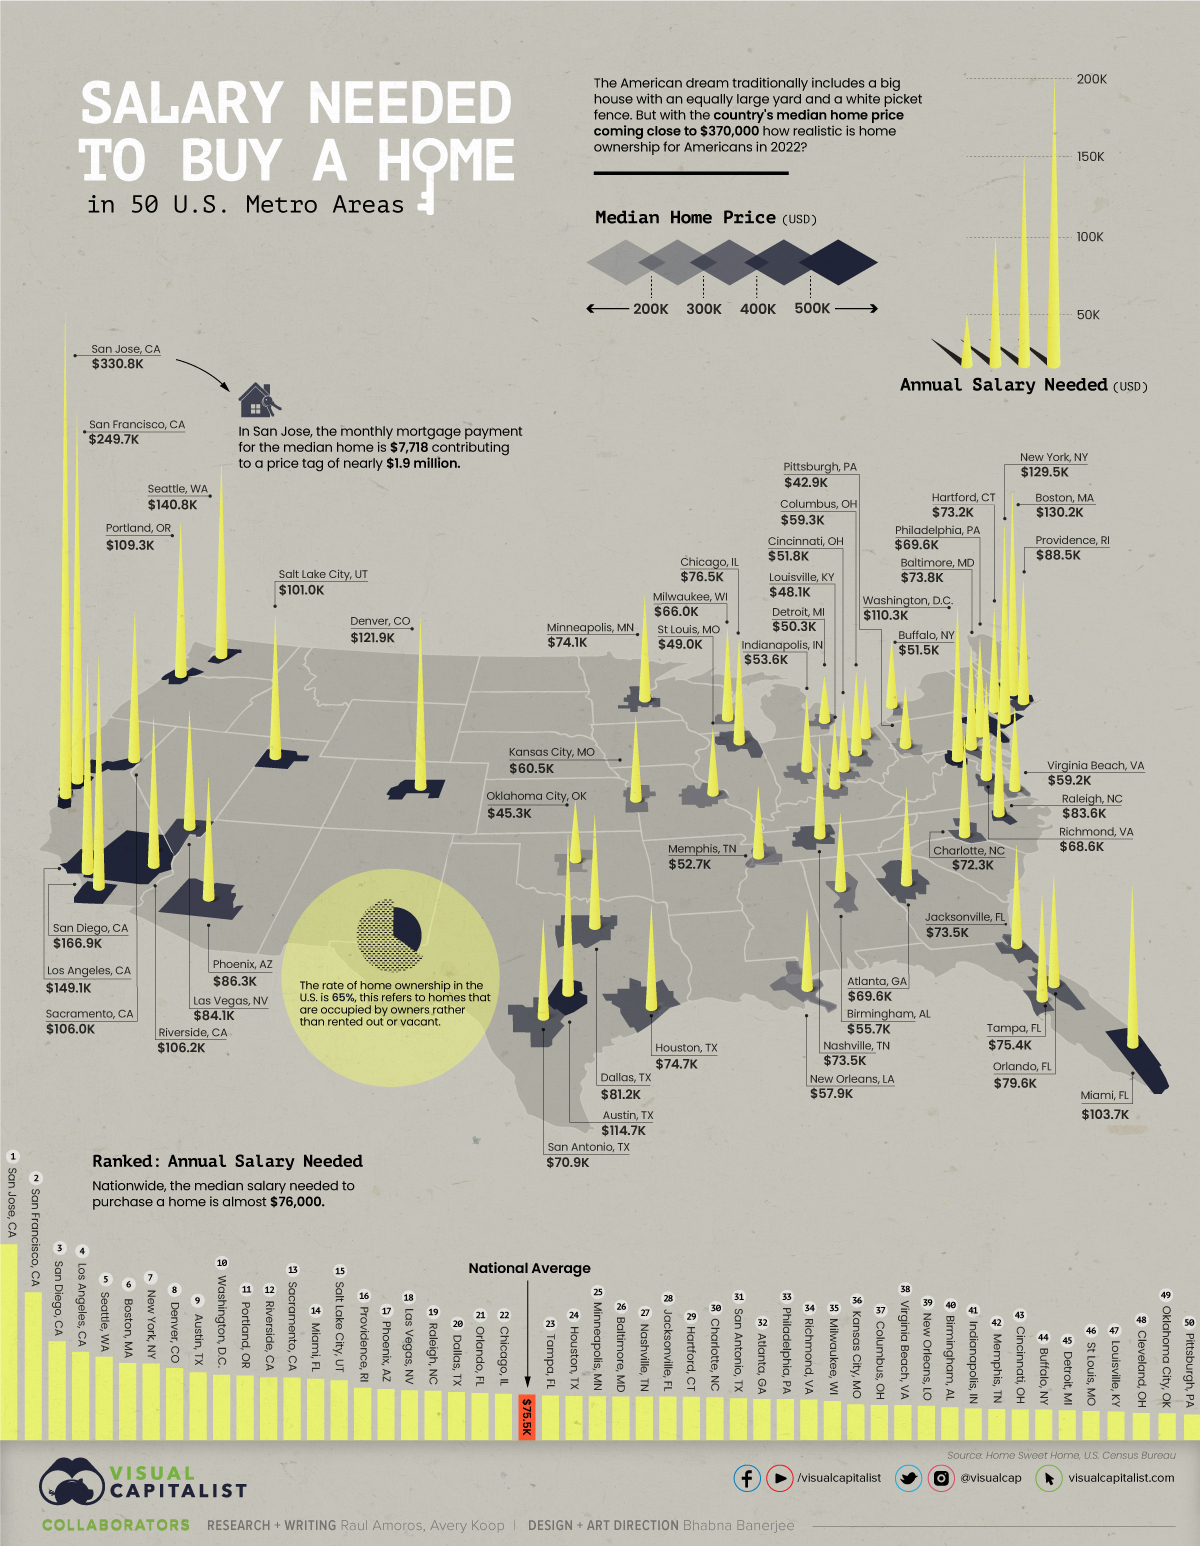
Depending on where you live, owning a home may seem like a far off dream or it could be fairly realistic. In New York City, for example, a person needs to be making at least six figures to buy a home, but in Cleveland you could do it with just over $45,000 a year.
This visual, using data from Home Sweet Home, maps out the annual salary you’d need for home ownership in 50 different U.S. cities.
Note: The map above refers to entire metro areas and uses Q1 2022 data on median home prices. The necessary salary was calculated by the source, looking at the base cost of principal, interest, property tax, and homeowner’s insurance.
Home Ownership Across the U.S.
San Jose is by far the most expensive city when it comes to purchasing a home. A person would need to earn over $330,000 annually to pay off the mortgage at a monthly rate of $7,718.
Here’s a closer look at the numbers:
| Rank | Metro Area | Median Home Price | Salary Needed |
|---|---|---|---|
| #1 | San Jose | $1,875,000 | $330,758 |
| #2 | San Francisco | $1,380,000 | $249,685 |
| #3 | San Diego | $905,000 | $166,828 |
| #4 | Los Angeles | $792,500 | $149,127 |
| #5 | Seattle | $746,200 | $140,768 |
| #6 | Boston | $639,000 | $130,203 |
| #7 | New York City | $578,100 | $129,459 |
| #8 | Denver | $662,200 | $121,888 |
| #9 | Austin | $540,700 | $114,679 |
| #10 | Washington, D.C. | $553,000 | $110,327 |
| #11 | Portland | $570,500 | $109,267 |
| #12 | Riverside/San Bernardino | $560,000 | $106,192 |
| #13 | Sacramento | $545,000 | $105,934 |
| #14 | Miami | $530,000 | $103,744 |
| #15 | Salt Lake City | $556,900 | $100,970 |
| #16 | Providence | $406,700 | $88,477 |
| #17 | Phoenix | $474,500 | $86,295 |
| #18 | Las Vegas | $461,100 | $84,116 |
| #19 | Raleigh | $439,100 | $83,561 |
| #20 | Dallas | $365,400 | $81,165 |
| #21 | Orlando | $399,900 | $79,573 |
| #22 | Chicago | $325,400 | $76,463 |
| #23 | Tampa | $379,900 | $75,416 |
| #24 | Houston | $330,800 | $74,673 |
| #25 | Minneapolis | $355,800 | $74,145 |
| #26 | Baltimore | $350,900 | $73,803 |
| #27 | Nashville | $387,200 | $73,502 |
| #28 | Jacksonville | $365,900 | $73,465 |
| #29 | Hartford | $291,000 | $73,165 |
| #30 | Charlotte | $379,900 | $72,348 |
| #31 | San Antonio | $321,100 | $70,901 |
| #32 | Atlanta | $350,300 | $69,619 |
| #33 | Philadelphia | $297,900 | $69,569 |
| #34 | Richmond | $354,500 | $68,629 |
| #35 | Milwaukee | $298,800 | $65,922 |
| #36 | Kansas City | $287,400 | $60,507 |
| #37 | Columbus | $274,300 | $59,321 |
| #38 | Virginia Beach | $289,900 | $59,245 |
| #39 | New Orleans | $281,100 | $57,853 |
| #40 | Birmingham | $289,500 | $55,662 |
| #41 | Indianapolis | $271,600 | $53,586 |
| #42 | Memphis | $259,300 | $52,691 |
| #43 | Cincinnati | $244,300 | $51,840 |
| #44 | Buffalo | $202,300 | $51,525 |
| #45 | Detroit | $224,300 | $50,302 |
| #46 | St Louis | $216,700 | $48,988 |
| #47 | Louisville | $235,400 | $48,121 |
| #48 | Cleveland | $192,700 | $45,448 |
| #49 | Oklahoma City | $198,200 | $45,299 |
| #50 | Pittsburgh | $185,700 | $42,858 |
Perhaps surprisingly, Boston residents need slightly higher earnings than New Yorkers to buy a home. The same is also true in Seattle and Los Angeles. Meanwhile, some of the cheapest cities to start buying up real estate in are Oklahoma City and Cleveland.
As of April, the rate of home ownership in the U.S. is 65%. This number represents the share of homes that are occupied by the owner, rather than rented out or vacant.
The American Dream Home
As of the time of this data (Q1 2022), the national yearly fixed mortgage rate sat at 4% and median home price at $368,200. This put the salary needed to buy a home at almost $76,000—the median national household income falls almost $9,000 below that.
But what kind of homes are people looking to purchase? Depending on where you live the type of home and square footage you can get will be very different.
In New York City, for example, there are fairly few stand-alone, single-family houses in the traditional sense—only around 4,000 are ever on the market. People in the Big Apple tend to buy condominiums or multi-family units.
Additionally, if you’re looking for luxury, not even seven figures will get you much in the big cities. In Miami, a million dollars will only buy you 833 square feet of prime real estate.
One thing is for sure: the typical American dream home of the big house with a yard and white picket fence is more attainable in smaller metro areas with ample suburbs.
Buying vs. Renting
The U.S. median household income is $67,500, meaning that today the typical family could only afford a home in about 15 of the 50 metro areas highlighted above, including New Orleans, Buffalo, and Indianapolis.
With the income gap widening in the U.S., the rental market remains a more attractive option for many, especially as prices are finally tapering off. The national median rent price was down nearly 3% from June to July for two-bedroom apartments.
At the end of the day, buying a home can be an important investment and may provide a sense of security, but it will be much easier to do in certain types of cities.


Personal Finance
Chart: The Declining Value of the U.S. Federal Minimum Wage
This graphic compares the nominal vs. inflation-adjusted value of the U.S. minimum wage, from 1940 to 2023.


The Declining Value of the U.S. Federal Minimum Wage
This was originally posted on our Voronoi app. Download the app for free on iOS or Android and discover incredible data-driven charts from a variety of trusted sources.
This graphic illustrates the history of the U.S. federal minimum wage using data compiled by Statista, in both nominal and real (inflation-adjusted) terms. The federal minimum wage was raised to $7.25 per hour in July 2009, where it has remained ever since.
Nominal vs. Real Value
The data we used to create this graphic can be found in the table below.
| Year | Nominal value ($/hour) | Real value ($/hour) |
|---|---|---|
| 1940 | 0.3 | 6.5 |
| 1945 | 0.4 | 6.82 |
| 1950 | 0.75 | 9.64 |
| 1955 | 0.75 | 8.52 |
| 1960 | 1 | 10.28 |
| 1965 | 1.25 | 12.08 |
| 1970 | 1.6 | 12.61 |
| 1975 | 2.1 | 12.04 |
| 1980 | 3.1 | 11.61 |
| 1985 | 3.35 | 9.51 |
| 1990 | 3.8 | 8.94 |
| 1995 | 4.25 | 8.49 |
| 2000 | 5.15 | 9.12 |
| 2005 | 5.15 | 8.03 |
| 2010 | 7.25 | 10.09 |
| 2015 | 7.25 | 9.3 |
| 2018 | 7.25 | 8.78 |
| 2019 | 7.25 | 8.61 |
| 2020 | 7.25 | 8.58 |
| 2021 | 7.25 | 8.24 |
| 2022 | 7.25 | 7.61 |
| 2023 | 7.25 | 7.25 |
What our graphic shows is how inflation has eroded the real value of the U.S. minimum wage over time, despite nominal increases.
For instance, consider the year 1960, when the federal minimum wage was $1 per hour. After accounting for inflation, this would be worth around $10.28 today!
The two lines converge at 2023 because the nominal and real value are identical in present day terms.
Many States Have Their Own Minimum Wage
According to the National Conference of State Legislatures (NCSL), 30 states and Washington, D.C. have implemented a minimum wage that is higher than $7.25.
The following states have adopted the federal minimum: Georgia, Idaho, Indiana, Iowa, Kansas, Kentucky, New Hampshire, North Carolina, North Dakota, Oklahoma, Pennsylvania, Texas, Utah, Wisconsin, and Wyoming.
Meanwhile, the states of Alabama, Louisiana, Mississippi, South Carolina, and Tennessee have no wage minimums, but have to follow the federal minimum.
How Does the U.S. Minimum Wage Rank Globally?
If you found this topic interesting, check out Mapped: Minimum Wage Around the World to see which countries have the highest minimum wage in monthly terms, as of January 2023.

-

 Debt1 week ago
How Debt-to-GDP Ratios Have Changed Since 2000
-

 Markets2 weeks ago
Ranked: The World’s Top Flight Routes, by Revenue
-

 Countries2 weeks ago
Population Projections: The World’s 6 Largest Countries in 2075
-

 Markets2 weeks ago
The Top 10 States by Real GDP Growth in 2023
-

 Demographics2 weeks ago
The Smallest Gender Wage Gaps in OECD Countries
-

 United States2 weeks ago
Where U.S. Inflation Hit the Hardest in March 2024
-

 Green2 weeks ago
Top Countries By Forest Growth Since 2001
-

 United States2 weeks ago
Ranked: The Largest U.S. Corporations by Number of Employees