Economy
Visualized: The Value of U.S. Imports of Goods by State
Visualized: The Value of U.S. Imports of Goods by State 2021
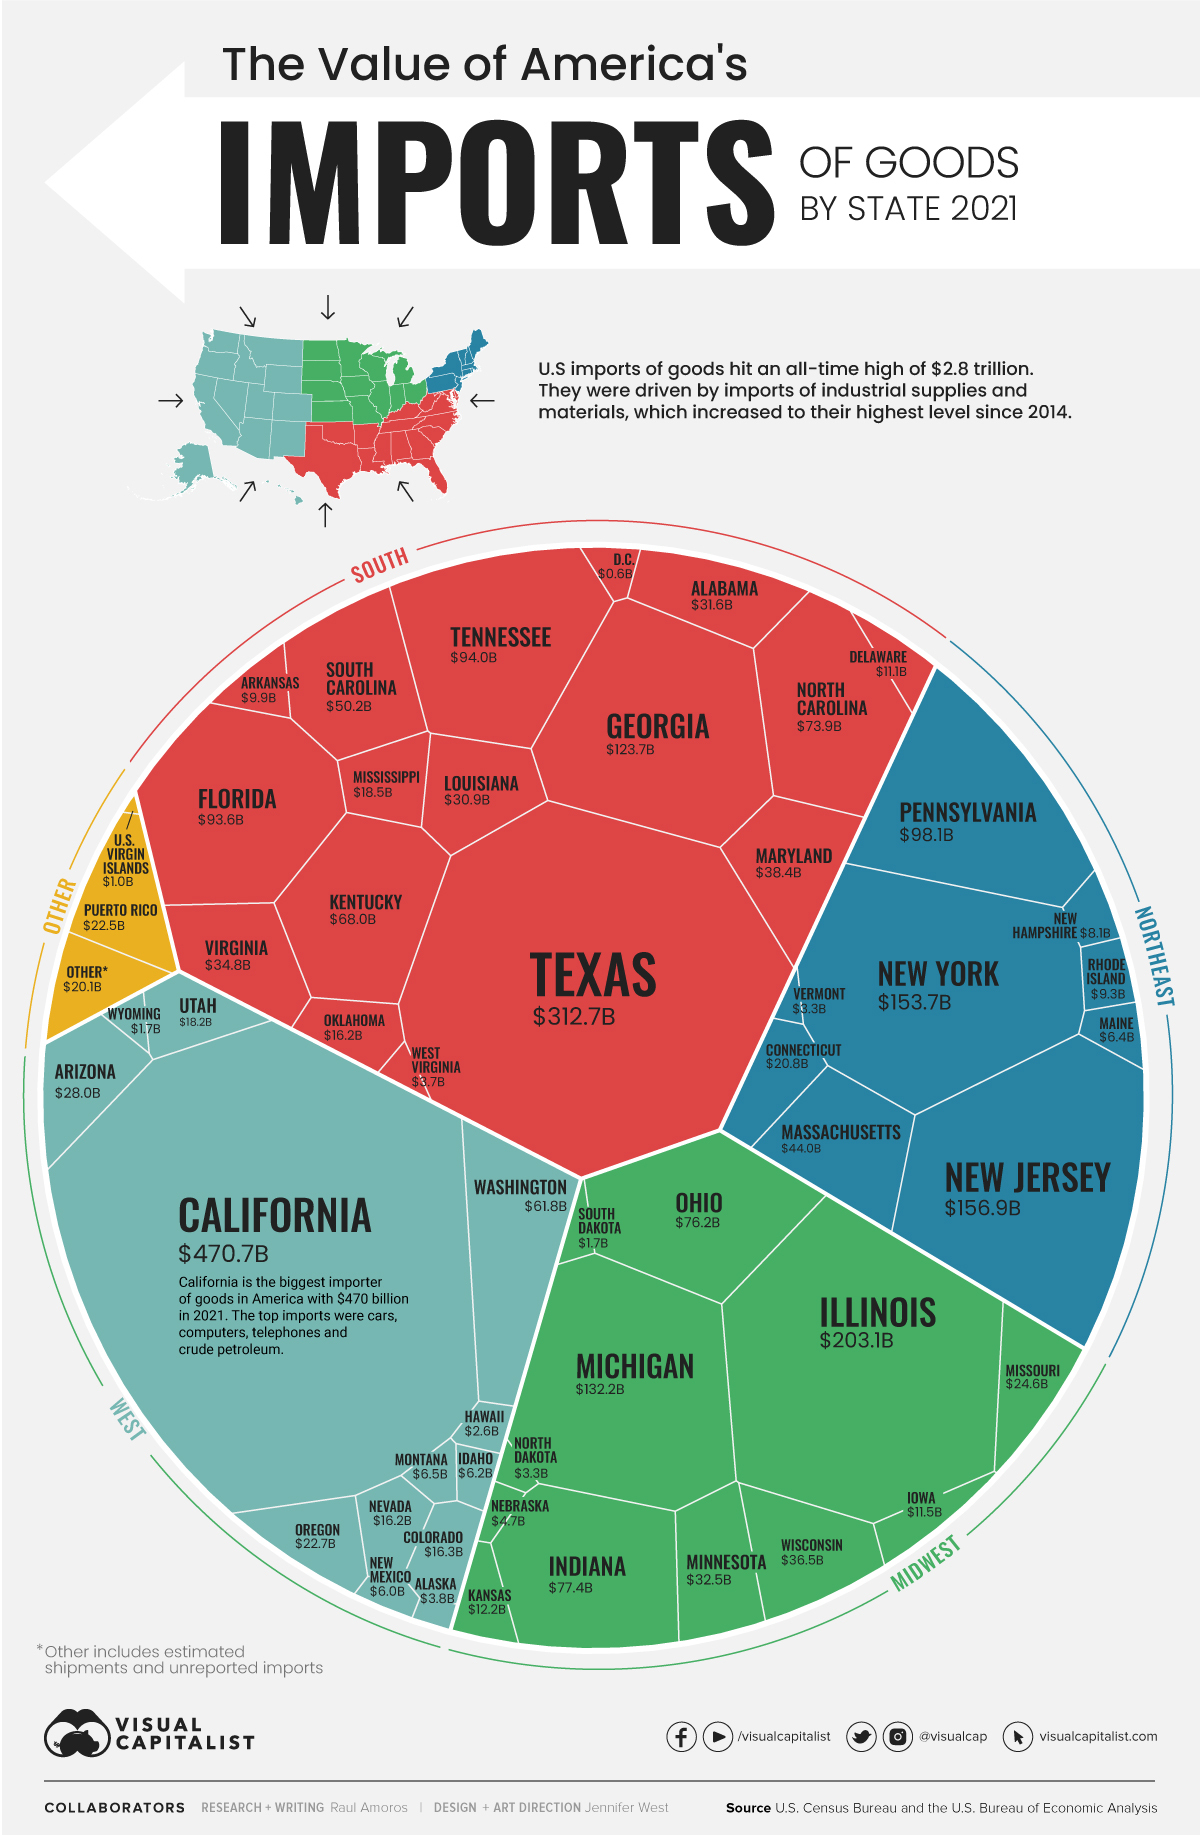
For nearly 50 years and counting, U.S. imports have exceeded exports—and 2021 was no exception. Imports of goods to the U.S. equaled $2.8 trillion, relative to $1.8 trillion for exports, putting the 2021 goods trade deficit at its highest level on record.
Using the most recent data on global trade from the U.S. Census Bureau and the U.S. Bureau of Economic Analysis, we take a closer look at the value of American goods imports and visualize them state by state.
The Top 10 Importing States, by Total Goods Value
The top 10 states by import value account for 64.5% of all U.S. imports, or $1.8 trillion.
| Rank | State | Import Value ($B) | Share (%) |
|---|---|---|---|
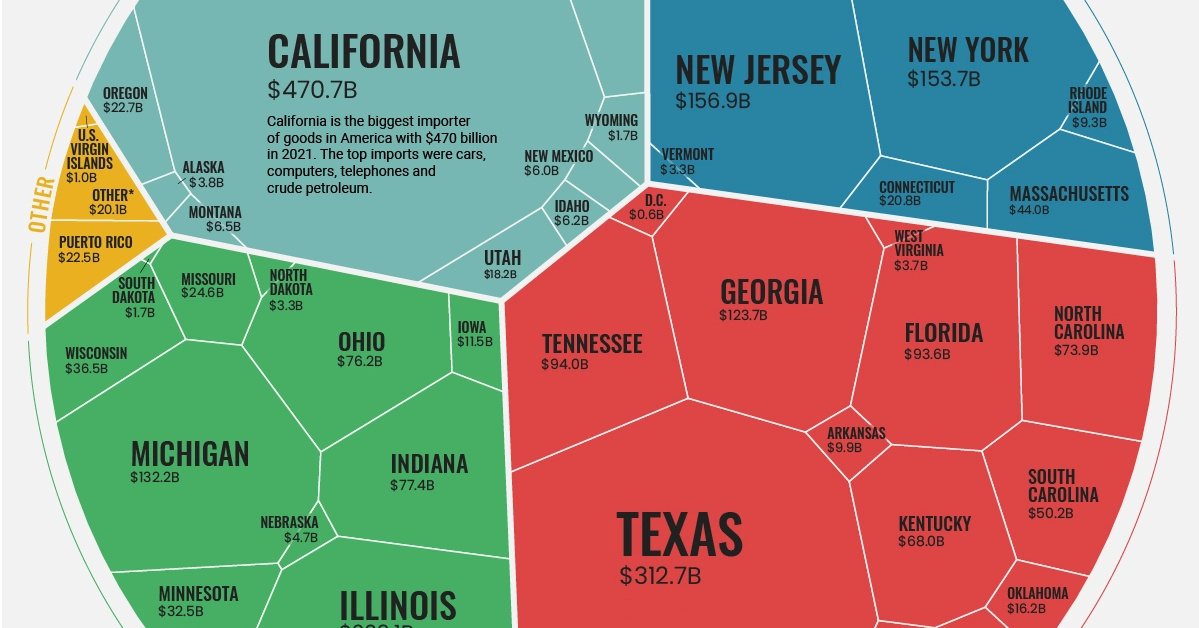
| #1 | California | $470.7 | 16.5% |
| #2 | Texas | $312.6 | 11.0% |
| #3 | Illinois | $203.1 | 7.1% |
| #4 | New Jersey | $156.9 | 5.5% |
| #5 | New York | $153.7 | 5.4% |
| #6 | Michigan | $132.2 | 4.6% |
| #7 | Georgia | $123.7 | 4.3% |
| #8 | Pennsylvania | $98.1 | 3.4% |
| #9 | Tennessee | $94.0 | 3.3% |
| #10 | Florida | $93.6 | 3.3% |
| Top 10 States | $1,838.6 | 64.5% |
Overall, the goods trade deficit—the amount by which a country’s imports exceed its exports—was more than $1 trillion in 2021, increasing over 18% from the previous year. Goods imports specifically increased by nearly $502 billion, a 21% increase year-over-year.
California, the U.S.’s top importer, saw over $470 billion worth of goods come in last year. Some of its big ticket items fell in line with the state’s tech sector’s needs, like automatic data processing machines and accessories and parts for said machinery. California’s own deficit is quite high—the state’s goods exports were only valued at approximately $175 billion. The state’s busy ports are a key entry point for goods arriving from Asia, which helps explain this deficit.
In contrast, the country’s top export state is Texas at $375 billion, outweighing its imports and shipping out goods like coal and petroleum. All but three of the country’s top importers—Tennessee, Pennsylvania, and Georgia—were also among the country’s top 10 exporters.
Where are Imports Coming From?
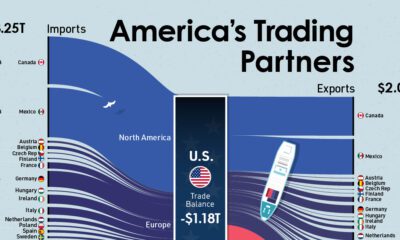
Here’s a look at the country’s top trade partners for goods imports and the value of their imports in 2022 as of April.
| Rank | Country | Import Value ($B) as of April '22 | Share of Total |
|---|---|---|---|
| #1 | 🇨🇳 China | $179.3 | 17.0% |
| #2 | 🇲🇽 Mexico | $145.1 | 13.8% |
| #3 | 🇨🇦 Canada | $141.7 | 13.5% |
| #4 | 🇯🇵 Japan | $49.6 | 4.7% |
| #5 | 🇩🇪 Germany | $44.2 | 4.2% |
| #6 | 🇻🇳 Vietnam | $40.5 | 3.8% |
| #7 | 🇰🇷 South Korea | $36.5 | 3.5% |
| #8 | 🇹🇼 Taiwan | $29.6 | 2.8% |
| #9 | 🇮🇳 India | $27.5 | 2.6% |
| #10 | 🇮🇪 Ireland | $26.5 | 2.5% |
Over half of the top import partners for the United States are located in Asia. China is by far America’s top source of goods, making up 17% of the country’s imports.
Meanwhile, Canada and Mexico each account for roughly 14% of America’s goods imports due to the close proximity, strong economic ties, and trade agreements.
What’s Being Imported?
Imports of goods increased to a value of $2.8 trillion in 2021, the highest on record. According to the U.S. Census Bureau, industrial supplies and materials and crude oil saw some of the most notable increases.
Consumer goods like cell phones, household goods, toys, games, and sporting equipment increased in import value as well, reflecting a trend that the pandemic’s online shopping and delivery demand started.
Additionally, imports of foods, feeds, and beverages were the highest on record in 2021. It is also notable that in April of 2022, exports of goods hit the highest number on record at nearly $175 billion, with exports of feeds, food, and beverage also reaching the highest number of exports recorded. This is likely attributed to food shortages worldwide caused by the war in Ukraine.


Misc
Visualizing the Most Common Pets in the U.S.
Lions, tigers, and bears, oh my!—these animals do not feature on this list of popular American household pets.


Visualizing The Most Common Pets in the U.S.
This was originally posted on our Voronoi app. Download the app for free on iOS or Android and discover incredible data-driven charts from a variety of trusted sources.
In this graphic, we visualized the most common American household pets, based on 2023-2024 data from the American Pet Products Association (accessed via Forbes Advisor).
Figures represent the number of households that own each pet type, rather than the actual number of each animal. The “small animal” category includes hamsters, gerbils, rabbits, guinea pigs, chinchillas, mice, rats, and ferrets.
What is the Most Popular American Household Pet?
Based on this data, dogs—one of the first domesticated animals—are the most common pets in the United States. In fact, around 65 million households own a dog, and spend an average of $900 a year on their care.
| Rank | Species | Households |
|---|---|---|
| 1 | 🐶 Dog | 65M |
| 2 | 🐱 Cat | 47M |
| 3 | 🐟 Freshwater Fish | 11M |
| 4 | 🐰 Small Animals | 7M |
| 5 | 🐦 Bird | 6M |
| 6 | 🦎 Reptile | 6M |
| 7 | 🐴 Horse | 2M |
| 8 | 🐠 Saltwater Fish | 2M |
Note: Households can own multiple pets, and are counted for all relevant categories.
Cats rank second, at 47 million households, and these smaller felines are a little less expensive to own at $700/year according to Forbes estimates.
But aside from these two juggernauts, there are plenty of other common pet types found in households across the country.
Freshwater fish can be found in 11 million households, along with small animals—rabbits, hamsters, guinea pigs—in 7 million. Meanwhile, nearly 6 million homes have birds or reptiles.
Pet Ownership is on the Rise in America
Forbes found that 66% of all American households (numbering 87 million) own at least one pet, up from 56% in 1988. One third of these (29 million) own multiple pets.
A combination of factors is driving this increase: rising incomes, delayed childbirth, and of course the impact of the pandemic which nearly cleared out animal shelters across the globe.
America’s loneliness epidemic may also be a factor. Fledgling research has shown that single-individual households with pets recorded lower rates of loneliness during the pandemic than those without a pet.

-

 Science1 week ago
Visualizing the Average Lifespans of Mammals
-

 Demographics2 weeks ago
The Smallest Gender Wage Gaps in OECD Countries
-

 United States2 weeks ago
Where U.S. Inflation Hit the Hardest in March 2024
-

 Green2 weeks ago
Top Countries By Forest Growth Since 2001
-

 United States2 weeks ago
Ranked: The Largest U.S. Corporations by Number of Employees
-

 Maps2 weeks ago
The Largest Earthquakes in the New York Area (1970-2024)
-

 Green2 weeks ago
Ranked: The Countries With the Most Air Pollution in 2023
-

 Green2 weeks ago
Ranking the Top 15 Countries by Carbon Tax Revenue