Markets
Ranked: America’s Best States to Do Business In


Ranked: America’s Best States to Do Business In
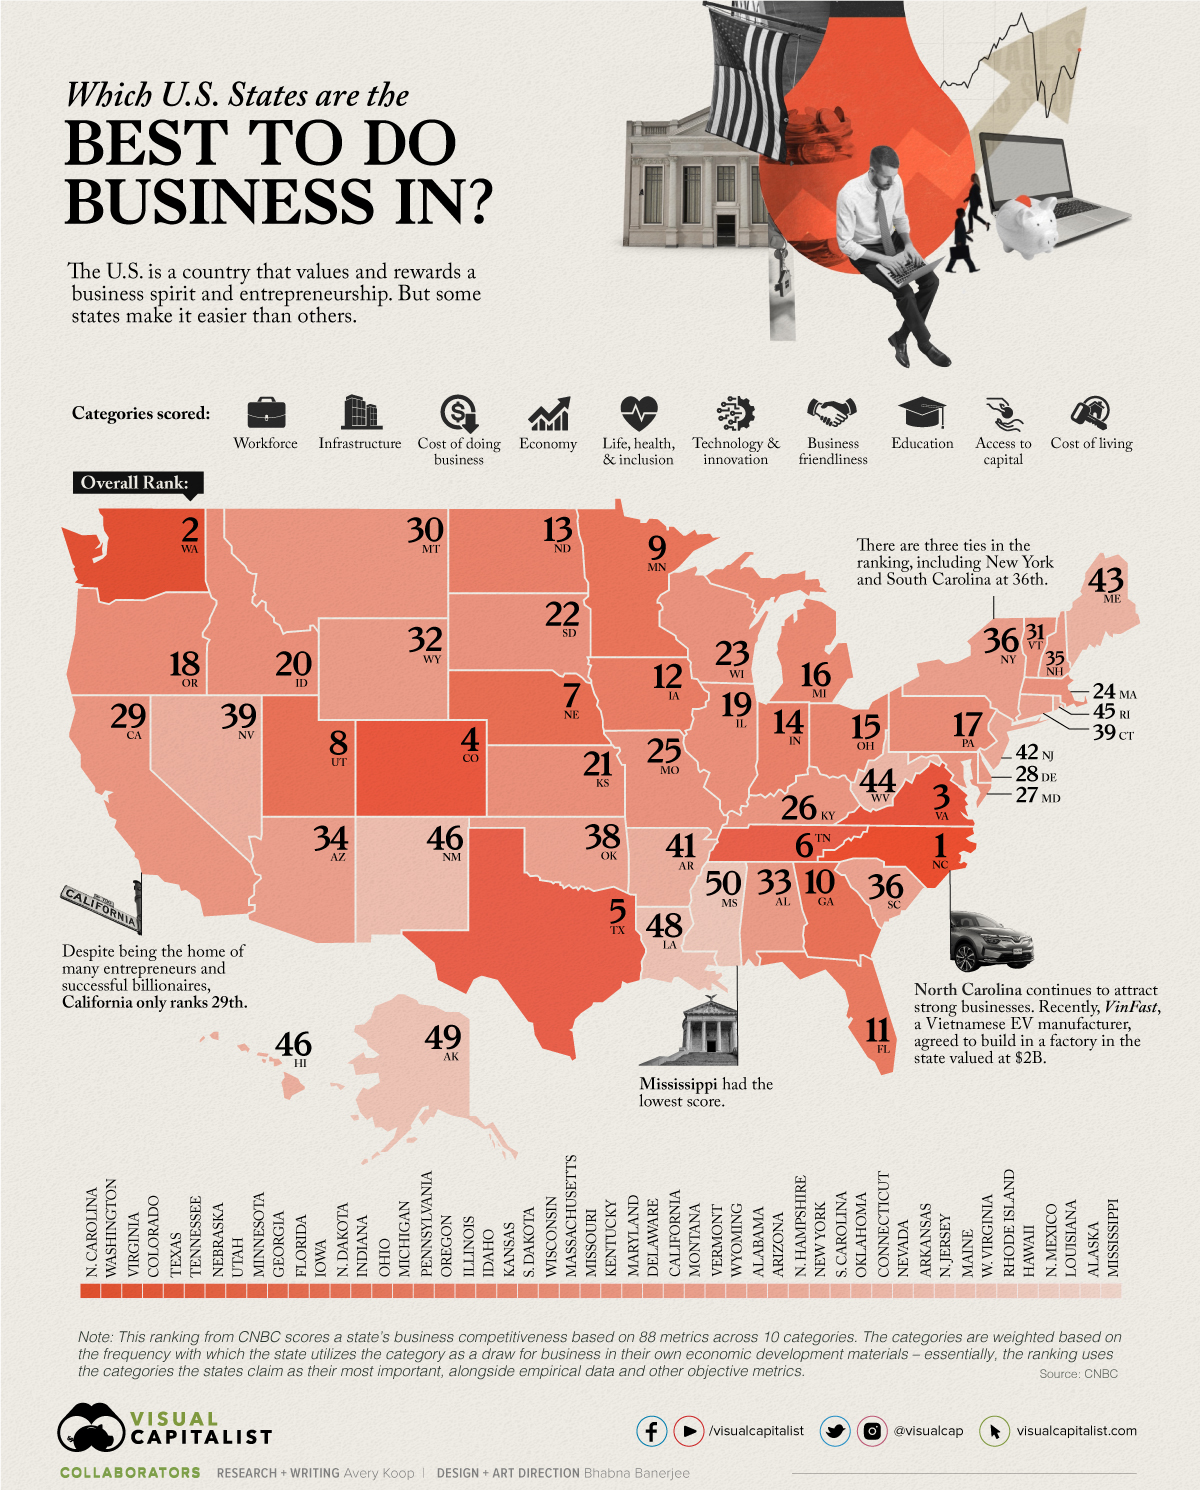
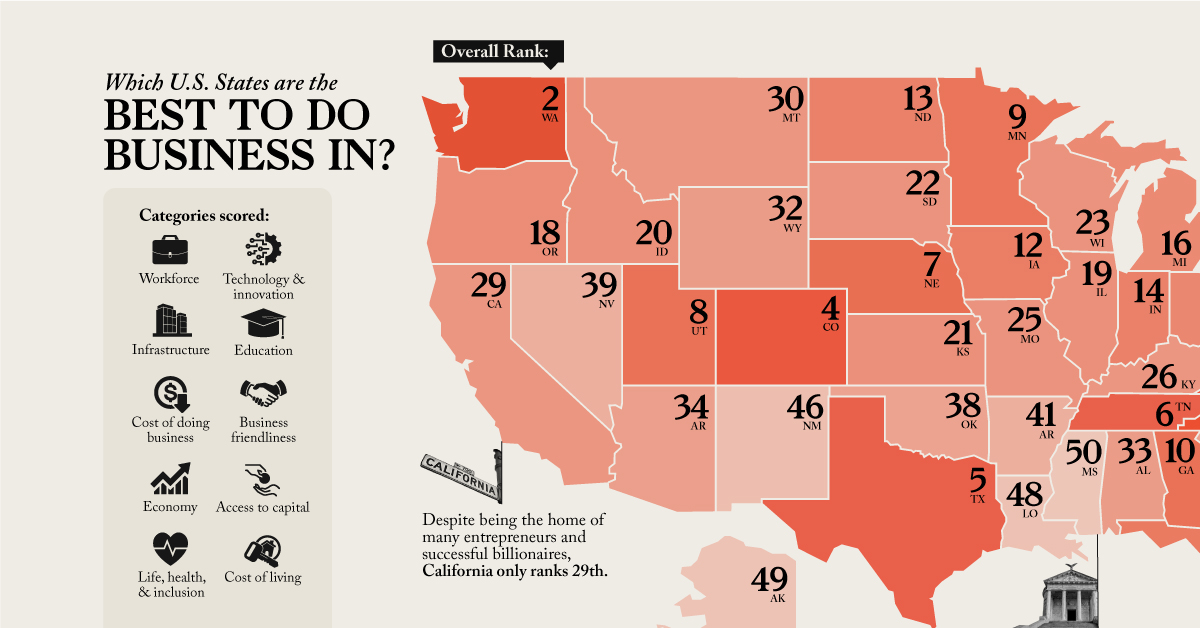
The United States often ranks as one of the best countries to start a business in, but the ease with which one can do business varies state by state. There are many considerations that factor into starting a business like the available workforce, the condition of local infrastructure, access to investors, a culture that’s open to business, and so on.
This map ranks America’s best states to do business in based on a study from CNBC which measured 88 factors across 10 broad categories.
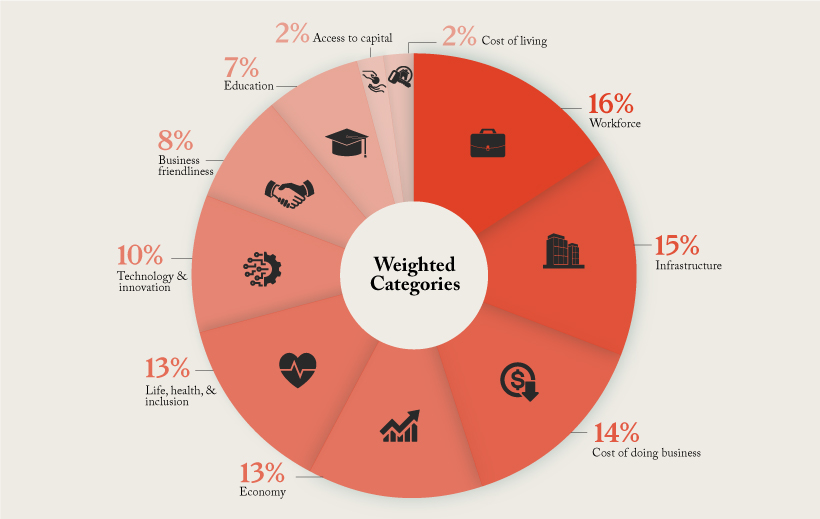
Methodology
Here is a further breakdown of the weight given to each of the 10 categories:
The Most Business Friendly States
North Carolina—coming in first place in the ranking—attracts an extremely talented and innovative workforce, largely thanks to the state’s investment in its Research Triangle Regional Partnership (RTRP).
| Overall Rank | State |
|---|---|
| #1 | North Carolina |
| #2 | Washington |
| #3 | Virginia |
| #4 | Colorado |
| #5 | Texas |
| #6 | Tennessee |
| #7 | Nebraska |
| #8 | Utah |
| #9 | Minnesota |
| #10 | Georgia |
| #11 | Florida |
| #12 | Iowa |
| #13 | North Dakota |
| #14 | Indiana |
| #15 | Ohio |
| #16 | Michigan |
| #17 | Pennsylvania |
| #18 | Oregon |
| #19 | Illinois |
| #20 | Idaho |
| #21 | Kansas |
| #22 | South Dakota |
| #23 | Wisconsin |
| #24 | Massachusetts |
| #25 | Missouri |
| #26 | Kentucky |
| #27 | Maryland |
| #28 | Delaware |
| #29 | California |
| #30 | Montana |
| #31 | Vermont |
| #32 | Wyoming |
| #33 | Alabama |
| #34 | Arizona |
| #35 | New Hampshire |
| #36 | New York |
| #36 | South Carolina |
| #38 | Oklahoma |
| #39 | Connecticut |
| #39 | Nevada |
| #41 | Arkansas |
| #42 | New Jersey |
| #43 | Maine |
| #44 | West Virginia |
| #45 | Rhode Island |
| #46 | Hawaii |
| #46 | New Mexico |
| #48 | Louisiana |
| #49 | Alaska |
| #50 | Mississippi |
Notably, there are three ties in the ranking: New York and South Carolina had the same score, tying for 36th, Connecticut and Nevada tied for 39th, and Hawaii and New Mexico tied for 46th.
Other states ranking high on the list are Washington, Virginia, and Colorado. One of the newest individual metrics CNBC took into consideration was an openness to the cannabis industry, likely playing into Colorado’s move up from 8th to 4th compared to last year.
Some states that perhaps surprisingly don’t crack the top 10 include California and New York, both often considered centers of finance and entrepreneurship. But with the high costs of living and of starting a business in those states, their overall score is reduced.
A Look at the Scoring — North Carolina, California, and Nevada
To better understand how this ranking works we’ve broken down three different states and how they ranked in all 10 categories that gave them their overall spot. Here’s a brief look at their place in each category:
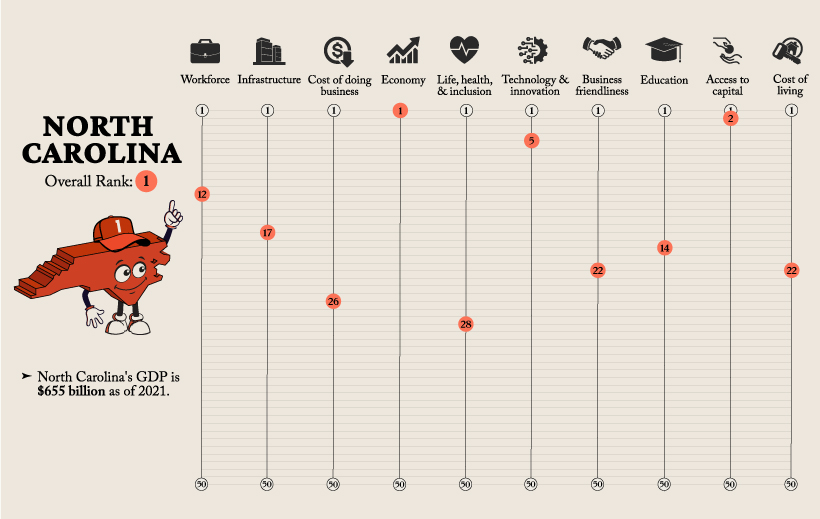
While North Carolina is the number one state to do business in and has an extremely strong economy, they are 26th when it comes to the Cost of Doing Business.
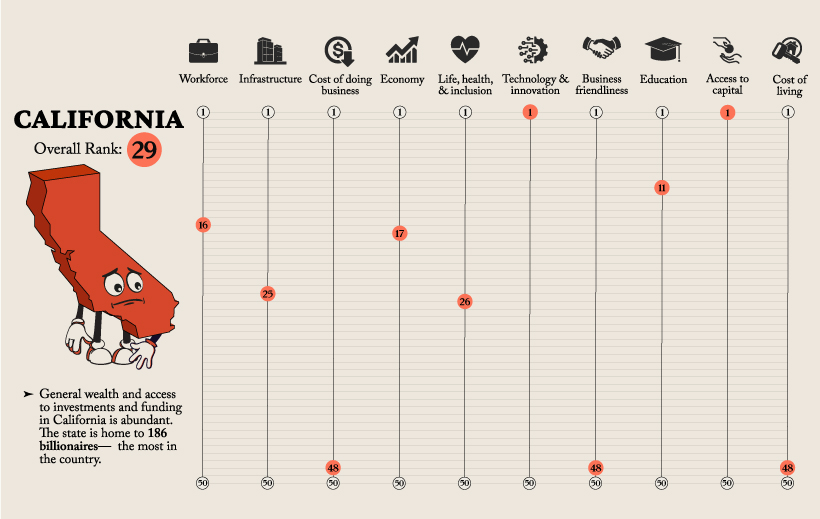
Whereas California ranks low overall, the state ranks first in terms of Technology and Innovation, as well as Access to Capital.
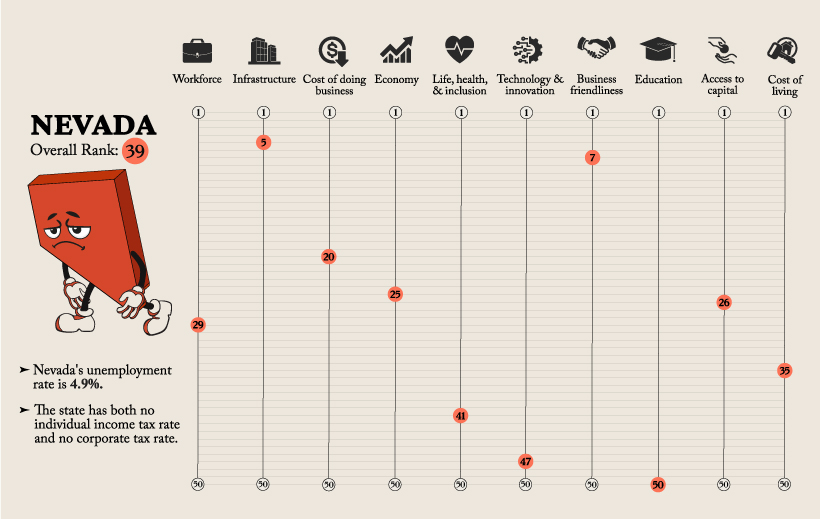
Although Nevada scored highly in the Infrastructure and Business Friendliness categories, the state scored poorly in Technology and Innovation, and was dead last in the Education category.
Doing Business in America
New business applications have actually decreased 4% this year in comparison to the same timeframe in 2021.
Here’s a look at new business applications by region as of July 2022:
- Northeast: 63,058
- Midwest: 70,827
- South: 197,663
- West: 94,150
New business applications in July were the highest in the retail trade industry, numbering around 69,000 new applications, according to the U.S. Census Bureau. Applications for professional service businesses were the second highest at 53,000, followed closely by construction businesses at 43,000.
Here’s a closer look at the industry breakdown:
| Industry | Number of Applications |
|---|---|
| Retail Trade | 68,974 |
| Professional Services | 53,321 |
| Construction | 43,442 |
| Other Services | 38,605 |
| Transportation and Warehousing | 34,952 |
| Administrative and Support | 31,602 |
| Health Care and Social Assistance | 25,725 |
| Accommodation and Food Services | 24,166 |
| Real Estate | 23,953 |
| Finance and Insurance | 18,890 |
| Arts and Entertainment | 12,684 |
| Unclassified | 12,350 |
| Wholesale Trade | 8,893 |
| Information | 7,802 |
| Educational Services | 5,762 |
| Manufacturing | 5,744 |
| Management of Companies | 4,166 |
| Agriculture | 3,703 |
| Mining | 542 |
| Utilities | 421 |
A potential looming recession, alongside rising interest rates and inflation, may be creating a sense of cautiousness among businesspeople, leading to the lower rate of business applications compared to last year. And, at existing companies, the economic situation has lead to cuts in growth forecasts and subsequently, major layoffs.
But overall, the U.S. is a country which values entrepreneurship—even during the pandemic, massive spikes in new business formations were recorded—and certain industries and states will continue to flourish in any business environment.


Markets
The European Stock Market: Attractive Valuations Offer Opportunities
On average, the European stock market has valuations that are nearly 50% lower than U.S. valuations. But how can you access the market?


European Stock Market: Attractive Valuations Offer Opportunities
Europe is known for some established brands, from L’Oréal to Louis Vuitton. However, the European stock market offers additional opportunities that may be lesser known.
The above infographic, sponsored by STOXX, outlines why investors may want to consider European stocks.
Attractive Valuations
Compared to most North American and Asian markets, European stocks offer lower or comparable valuations.
| Index | Price-to-Earnings Ratio | Price-to-Book Ratio |
|---|---|---|
| EURO STOXX 50 | 14.9 | 2.2 |
| STOXX Europe 600 | 14.4 | 2 |
| U.S. | 25.9 | 4.7 |
| Canada | 16.1 | 1.8 |
| Japan | 15.4 | 1.6 |
| Asia Pacific ex. China | 17.1 | 1.8 |
Data as of February 29, 2024. See graphic for full index names. Ratios based on trailing 12 month financials. The price to earnings ratio excludes companies with negative earnings.
On average, European valuations are nearly 50% lower than U.S. valuations, potentially offering an affordable entry point for investors.
Research also shows that lower price ratios have historically led to higher long-term returns.
Market Movements Not Closely Connected
Over the last decade, the European stock market had low-to-moderate correlation with North American and Asian equities.
The below chart shows correlations from February 2014 to February 2024. A value closer to zero indicates low correlation, while a value of one would indicate that two regions are moving in perfect unison.
| EURO STOXX 50 | STOXX EUROPE 600 | U.S. | Canada | Japan | Asia Pacific ex. China |
|
|---|---|---|---|---|---|---|
| EURO STOXX 50 | 1.00 | 0.97 | 0.55 | 0.67 | 0.24 | 0.43 |
| STOXX EUROPE 600 | 1.00 | 0.56 | 0.71 | 0.28 | 0.48 | |
| U.S. | 1.00 | 0.73 | 0.12 | 0.25 | ||
| Canada | 1.00 | 0.22 | 0.40 | |||
| Japan | 1.00 | 0.88 | ||||
| Asia Pacific ex. China | 1.00 |
Data is based on daily USD returns.
European equities had relatively independent market movements from North American and Asian markets. One contributing factor could be the differing sector weights in each market. For instance, technology makes up a quarter of the U.S. market, but health care and industrials dominate the broader European market.
Ultimately, European equities can enhance portfolio diversification and have the potential to mitigate risk for investors.
Tracking the Market
For investors interested in European equities, STOXX offers a variety of flagship indices:
| Index | Description | Market Cap |
|---|---|---|
| STOXX Europe 600 | Pan-regional, broad market | €10.5T |
| STOXX Developed Europe | Pan-regional, broad-market | €9.9T |
| STOXX Europe 600 ESG-X | Pan-regional, broad market, sustainability focus | €9.7T |
| STOXX Europe 50 | Pan-regional, blue-chip | €5.1T |
| EURO STOXX 50 | Eurozone, blue-chip | €3.5T |
Data is as of February 29, 2024. Market cap is free float, which represents the shares that are readily available for public trading on stock exchanges.
The EURO STOXX 50 tracks the Eurozone’s biggest and most traded companies. It also underlies one of the world’s largest ranges of ETFs and mutual funds. As of November 2023, there were €27.3 billion in ETFs and €23.5B in mutual fund assets under management tracking the index.
“For the past 25 years, the EURO STOXX 50 has served as an accurate, reliable and tradable representation of the Eurozone equity market.”
— Axel Lomholt, General Manager at STOXX
Partnering with STOXX to Track the European Stock Market
Are you interested in European equities? STOXX can be a valuable partner:
- Comprehensive, liquid and investable ecosystem
- European heritage, global reach
- Highly sophisticated customization capabilities
- Open architecture approach to using data
- Close partnerships with clients
- Part of ISS STOXX and Deutsche Börse Group
With a full suite of indices, STOXX can help you benchmark against the European stock market.
Learn how STOXX’s European indices offer liquid and effective market access.

-

 Economy3 days ago
Economic Growth Forecasts for G7 and BRICS Countries in 2024
The IMF has released its economic growth forecasts for 2024. How do the G7 and BRICS countries compare?
-

 Markets2 weeks ago
U.S. Debt Interest Payments Reach $1 Trillion
U.S. debt interest payments have surged past the $1 trillion dollar mark, amid high interest rates and an ever-expanding debt burden.
-

 United States2 weeks ago
Ranked: The Largest U.S. Corporations by Number of Employees
We visualized the top U.S. companies by employees, revealing the massive scale of retailers like Walmart, Target, and Home Depot.
-

 Markets2 weeks ago
The Top 10 States by Real GDP Growth in 2023
This graphic shows the states with the highest real GDP growth rate in 2023, largely propelled by the oil and gas boom.
-

 Markets3 weeks ago
Ranked: The World’s Top Flight Routes, by Revenue
In this graphic, we show the highest earning flight routes globally as air travel continued to rebound in 2023.
-

 Markets3 weeks ago
Ranked: The Most Valuable Housing Markets in America
The U.S. residential real estate market is worth a staggering $47.5 trillion. Here are the most valuable housing markets in the country.

-

 Science1 week ago
Visualizing the Average Lifespans of Mammals
-
Markets2 weeks ago
The Top 10 States by Real GDP Growth in 2023
-

 Demographics2 weeks ago
The Smallest Gender Wage Gaps in OECD Countries
-

 United States2 weeks ago
Where U.S. Inflation Hit the Hardest in March 2024
-

 Green2 weeks ago
Top Countries By Forest Growth Since 2001
-
United States2 weeks ago
Ranked: The Largest U.S. Corporations by Number of Employees
-

 Maps2 weeks ago
The Largest Earthquakes in the New York Area (1970-2024)
-

 Green2 weeks ago
Ranked: The Countries With the Most Air Pollution in 2023