Markets
Visualized: The U.S. $20 Trillion Economy by State
 Can I share this graphic?
 When do I need a license?
 Interested in this piece?
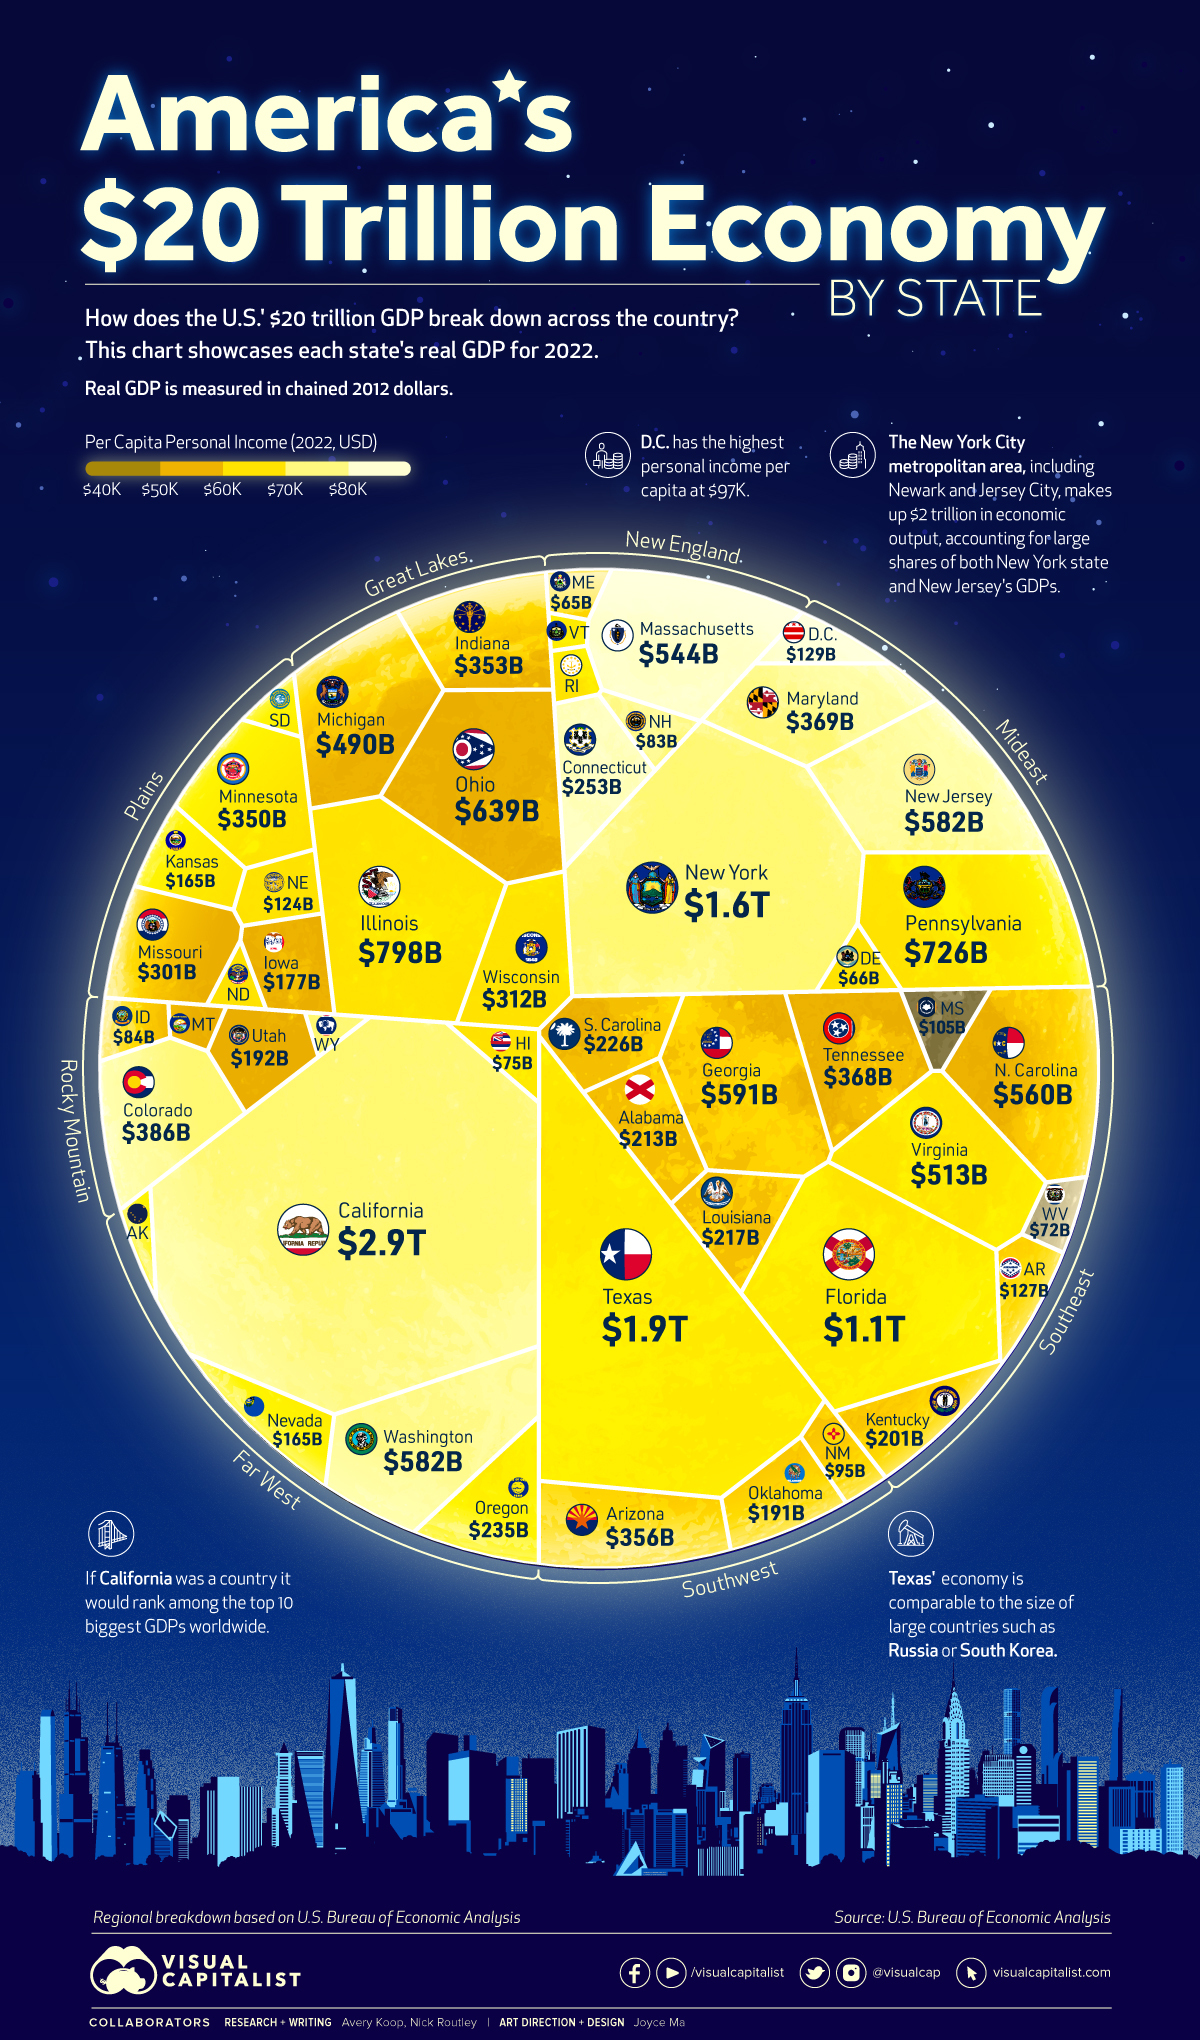
Visualized: The U.S. $20 Trillion Economy by State
A sum of its parts, every U.S. state plays an integral role in the country’s overall economy.
Texas, for example, generates an economic output that is comparable to South Korea’s, and even a small geographical area like Washington, D.C. outputs over $129 billion per year.
The visualization above uses 2022 annual data out of the U.S. Bureau of Economic Analysis (BEA) to showcase each state or district’s real gross domestic product (GDP) in chained 2012 dollars, while also highlighting personal income per capita.
A Closer Look at the States
California is by far the biggest state economy in the U.S. at $2.9 trillion in real GDP—and when comparing its nominal value ($3.6 trillion) with national GDPs worldwide, the Golden State’s GDP would rank 5th overall, just below Germany and Japan.
Here’s an up-close look at the data:
| Rank | State | Real GDP (chained 2012 dollars) |
|---|---|---|
| 1 | California | $2.9 trillion |
| 2 | Texas | $1.9 trillion |
| 3 | New York | $1.6 trillion |
| 4 | Florida | $1.1 trillion |
| 5 | Illinois | $798 billion |
| 6 | Pennsylvania | $726 billion |
| 7 | Ohio | $639 billion |
| 8 | Georgia | $591 billion |
| 9 | Washington | $582 billion |
| T9 | New Jersey | $582 billion |
| 11 | North Carolina | $560 billion |
| 12 | Massachusetts | $544 billion |
| 13 | Virginia | $513 billion |
| 14 | Michigan | $490 billion |
| 15 | Colorado | $386 billion |
| 16 | Maryland | $369 billion |
| 17 | Tennessee | $368 billion |
| 18 | Arizona | $356 billion |
| 19 | Indiana | $353 billion |
| 20 | Minnesota | $350 billion |
| 21 | Wisconsin | $312 billion |
| 22 | Missouri | $301 billion |
| 23 | Connecticut | $253 billion |
| 24 | Oregon | $235 billion |
| 25 | South Carolina | $226 billion |
| 26 | Louisiana | $217 billion |
| 27 | Alabama | $213 billion |
| 28 | Kentucky | $201 billion |
| 29 | Utah | $192 billion |
| 30 | Oklahoma | $191 billion |
| 31 | Iowa | $177 billion |
| 32 | Nevada | $165 billion |
| T32 | Kansas | $165 billion |
| 34 | District of Columbia | $129 billion |
| 35 | Arkansas | $127 billion |
| 36 | Nebraska | $124 billion |
| 37 | Mississippi | $105 billion |
| 38 | New Mexico | $95 billion |
| 39 | Idaho | $84 billion |
| 40 | New Hampshire | $83 billion |
| 41 | Hawaii | $75 billion |
| 42 | West Virginia | $72 billion |
| 43 | Delaware | $66 billion |
| 44 | Maine | $65 billion |
| 45 | Rhode Island | $55 billion |
| 46 | North Dakota | $53 billion |
| 47 | South Dakota | $50 billion |
| T47 | Montana | $50 billion |
| T47 | Alaska | $50 billion |
| 50 | Wyoming | $36 billion |
| 51 | Vermont | $31 billion |
| United States | $20 trillion |
Altogether, California, New York, and Texas account for almost one-third of the country’s economy, combining for $6.3 trillion in real GDP in 2022. The only other state that reached the trillion dollar mark is Florida with $1.1 trillion.
Texas’ economy is driven largely by industries like advanced manufacturing, biotech, life sciences, aerospace, and defense. The state is also home to a number of large companies, like Tesla and Texas Instruments, which make it a hub for jobs, innovation, and opportunity.
New York state is a leader in the insurance, agribusiness, clean energy, and cyber security industries, among many others. Zooming into the New York City area reveals huge sources of economic output from the tourism, media, and financial services sectors.
Regional Disparities
While the aforementioned states are the big hitters, the median GDP per state was much lower at $217 billion in 2022.
Under the BEA’s eight region breakdown, all states in the Great Lakes region had GDPs that were higher than the median, reflecting the industrial strength of states like Illinois and Ohio. Most of the states in the Mideast region including New York, Pennsylvania, and Maryland also have GDPs higher than the country median.
Comparatively, many states in the Plains region had lower GDPs, including Iowa and Kansas. Other states with lower GDPs (and generally lower populations) were spread around the country, including lowest-ranked Vermont in New England.
Personal Income per Capita
In addition to real GDP, this voronoi diagram has been color-coded in terms of personal income per capita in each state. Here’s a closer look at those figures:
| Rank | State | Personal Income per Capita |
|---|---|---|
| 1 | District of Columbia | $96,728 |
| 2 | Connecticut | $84,972 |
| 3 | Massachusetts | $84,945 |
| 4 | New Jersey | $78,700 |
| 5 | New York | $78,089 |
| 6 | California | $77,339 |
| 7 | Washington | $75,698 |
| 8 | New Hampshire | $74,663 |
| 9 | Colorado | $74,167 |
| 10 | Wyoming | $71,342 |
| 11 | Maryland | $70,730 |
| 12 | Alaska | $68,919 |
| 13 | Illinois | $68,822 |
| 14 | Virginia | $68,211 |
| 15 | Minnesota | $68,010 |
| 16 | North Dakota | $66,184 |
| 17 | South Dakota | $65,806 |
| 18 | Rhode Island | $65,377 |
| 19 | Pennsylvania | $65,167 |
| 20 | Florida | $63,597 |
| 21 | Nebraska | $63,321 |
| 22 | Vermont | $63,206 |
| 23 | Oregon | $62,767 |
| 24 | Texas | $61,985 |
| 25 | Delaware | $61,387 |
| 26 | Nevada | $61,282 |
| 27 | Wisconsin | $61,210 |
| 28 | Hawaii | $61,175 |
| 29 | Kansas | $60,152 |
| 30 | Maine | $59,463 |
| 31 | Iowa | $58,905 |
| 32 | Tennessee | $58,279 |
| 33 | Indiana | $57,930 |
| 34 | Utah | $57,925 |
| 35 | Ohio | $57,880 |
| 36 | Montana | $57,719 |
| 37 | North Carolina | $57,416 |
| 38 | Georgia | $57,129 |
| 39 | Michigan | $56,813 |
| 40 | Arizona | $56,667 |
| 41 | Missouri | $56,551 |
| 42 | Oklahoma | $54,998 |
| 43 | Louisiana | $54,622 |
| 44 | Idaho | $54,537 |
| 45 | South Carolina | $53,320 |
| 46 | Kentucky | $52,109 |
| 47 | Arkansas | $51,787 |
| 48 | New Mexico | $51,500 |
| 49 | Alabama | $50,637 |
| 50 | West Virginia | $49,169 |
| 51 | Mississippi | $46,248 |
Economic Engines and Future Growth
Many of the largest state economies are fueled by strong urban populations. These metropolitan cities are the economic engines of the country, driving innovation and attracting new talent.
The NYC-Newark-Jersey City metropolitan area is a great example of this, generating over $2 trillion in economic output alone. Los Angeles generated $1.1 trillion.
While these are the obvious and expected hubs, some new cities and states are beginning to attract new business and are anticipating significant economic growth. North Carolina, for example, has been ranked as the best U.S. state to do business in, thanks to a number of factors like ease of access to capital and a strong culture of tech and innovation.
Over time, the centers of economic power may be slowly shifting in the U.S., but for now the top contributors to the nation’s GDP far outpace the rest.


Markets
The European Stock Market: Attractive Valuations Offer Opportunities
On average, the European stock market has valuations that are nearly 50% lower than U.S. valuations. But how can you access the market?


European Stock Market: Attractive Valuations Offer Opportunities
Europe is known for some established brands, from L’Oréal to Louis Vuitton. However, the European stock market offers additional opportunities that may be lesser known.
The above infographic, sponsored by STOXX, outlines why investors may want to consider European stocks.
Attractive Valuations
Compared to most North American and Asian markets, European stocks offer lower or comparable valuations.
| Index | Price-to-Earnings Ratio | Price-to-Book Ratio |
|---|---|---|
| EURO STOXX 50 | 14.9 | 2.2 |
| STOXX Europe 600 | 14.4 | 2 |
| U.S. | 25.9 | 4.7 |
| Canada | 16.1 | 1.8 |
| Japan | 15.4 | 1.6 |
| Asia Pacific ex. China | 17.1 | 1.8 |
Data as of February 29, 2024. See graphic for full index names. Ratios based on trailing 12 month financials. The price to earnings ratio excludes companies with negative earnings.
On average, European valuations are nearly 50% lower than U.S. valuations, potentially offering an affordable entry point for investors.
Research also shows that lower price ratios have historically led to higher long-term returns.
Market Movements Not Closely Connected
Over the last decade, the European stock market had low-to-moderate correlation with North American and Asian equities.
The below chart shows correlations from February 2014 to February 2024. A value closer to zero indicates low correlation, while a value of one would indicate that two regions are moving in perfect unison.
| EURO STOXX 50 | STOXX EUROPE 600 | U.S. | Canada | Japan | Asia Pacific ex. China |
|
|---|---|---|---|---|---|---|
| EURO STOXX 50 | 1.00 | 0.97 | 0.55 | 0.67 | 0.24 | 0.43 |
| STOXX EUROPE 600 | 1.00 | 0.56 | 0.71 | 0.28 | 0.48 | |
| U.S. | 1.00 | 0.73 | 0.12 | 0.25 | ||
| Canada | 1.00 | 0.22 | 0.40 | |||
| Japan | 1.00 | 0.88 | ||||
| Asia Pacific ex. China | 1.00 |
Data is based on daily USD returns.
European equities had relatively independent market movements from North American and Asian markets. One contributing factor could be the differing sector weights in each market. For instance, technology makes up a quarter of the U.S. market, but health care and industrials dominate the broader European market.
Ultimately, European equities can enhance portfolio diversification and have the potential to mitigate risk for investors.
Tracking the Market
For investors interested in European equities, STOXX offers a variety of flagship indices:
| Index | Description | Market Cap |
|---|---|---|
| STOXX Europe 600 | Pan-regional, broad market | €10.5T |
| STOXX Developed Europe | Pan-regional, broad-market | €9.9T |
| STOXX Europe 600 ESG-X | Pan-regional, broad market, sustainability focus | €9.7T |
| STOXX Europe 50 | Pan-regional, blue-chip | €5.1T |
| EURO STOXX 50 | Eurozone, blue-chip | €3.5T |
Data is as of February 29, 2024. Market cap is free float, which represents the shares that are readily available for public trading on stock exchanges.
The EURO STOXX 50 tracks the Eurozone’s biggest and most traded companies. It also underlies one of the world’s largest ranges of ETFs and mutual funds. As of November 2023, there were €27.3 billion in ETFs and €23.5B in mutual fund assets under management tracking the index.
“For the past 25 years, the EURO STOXX 50 has served as an accurate, reliable and tradable representation of the Eurozone equity market.”
— Axel Lomholt, General Manager at STOXX
Partnering with STOXX to Track the European Stock Market
Are you interested in European equities? STOXX can be a valuable partner:
- Comprehensive, liquid and investable ecosystem
- European heritage, global reach
- Highly sophisticated customization capabilities
- Open architecture approach to using data
- Close partnerships with clients
- Part of ISS STOXX and Deutsche Börse Group
With a full suite of indices, STOXX can help you benchmark against the European stock market.
Learn how STOXX’s European indices offer liquid and effective market access.

-

 Economy3 days ago
Economic Growth Forecasts for G7 and BRICS Countries in 2024
The IMF has released its economic growth forecasts for 2024. How do the G7 and BRICS countries compare?
-

 Markets2 weeks ago
U.S. Debt Interest Payments Reach $1 Trillion
U.S. debt interest payments have surged past the $1 trillion dollar mark, amid high interest rates and an ever-expanding debt burden.
-

 United States2 weeks ago
Ranked: The Largest U.S. Corporations by Number of Employees
We visualized the top U.S. companies by employees, revealing the massive scale of retailers like Walmart, Target, and Home Depot.
-

 Markets2 weeks ago
The Top 10 States by Real GDP Growth in 2023
This graphic shows the states with the highest real GDP growth rate in 2023, largely propelled by the oil and gas boom.
-

 Markets3 weeks ago
Ranked: The World’s Top Flight Routes, by Revenue
In this graphic, we show the highest earning flight routes globally as air travel continued to rebound in 2023.
-

 Markets3 weeks ago
Ranked: The Most Valuable Housing Markets in America
The U.S. residential real estate market is worth a staggering $47.5 trillion. Here are the most valuable housing markets in the country.

-

 Debt1 week ago
How Debt-to-GDP Ratios Have Changed Since 2000
-

 Countries2 weeks ago
Population Projections: The World’s 6 Largest Countries in 2075
-
Markets2 weeks ago
The Top 10 States by Real GDP Growth in 2023
-

 Demographics2 weeks ago
The Smallest Gender Wage Gaps in OECD Countries
-

 United States2 weeks ago
Where U.S. Inflation Hit the Hardest in March 2024
-

 Green2 weeks ago
Top Countries By Forest Growth Since 2001
-
United States2 weeks ago
Ranked: The Largest U.S. Corporations by Number of Employees
-

 Maps2 weeks ago
The Largest Earthquakes in the New York Area (1970-2024)