

The earthquake that shook buildings across New York in April 2024 was the third-largest quake in the Northeast U.S. over the past 50 years.


The U.S. residential real estate market is worth a staggering $47.5 trillion. Here are the most valuable housing markets in the country.
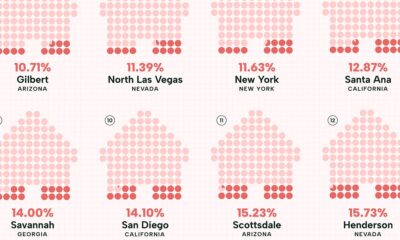

Visualizing the least affordable U.S. cities for renters by the percentage of affordable rentals available on an average salary.


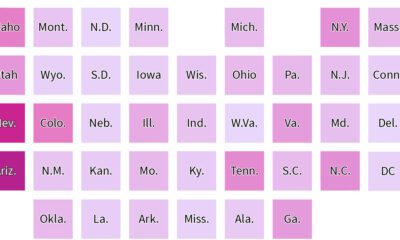
The U.S. might have a median age of 39, but the median age by state ranges from the low 30s to the mid 40s.


From someone born in the 19th century, in the midst of historic population growth, comes this vintage visualization showing world cities growing ever bigger.
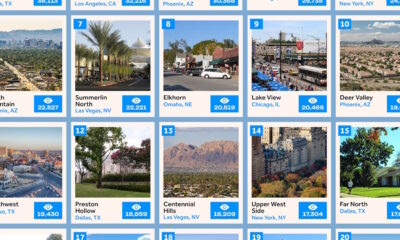

This infographic ranks the 20 most popular neighborhoods in the U.S. for homebuyers based on search interest.
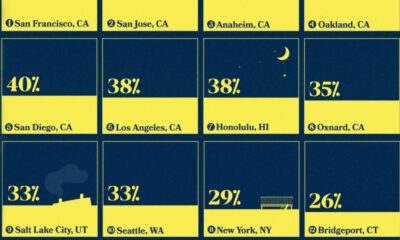

We highlight the top 15 U.S. metro areas by their percentage of million-dollar homes, from San Francisco to Miami.
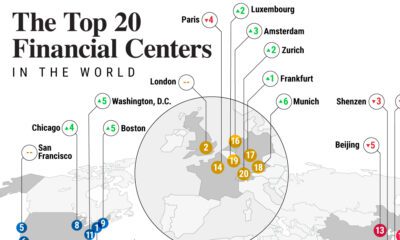

Where are the leading global financial centers in today's evolving economic landscape? Here are the top commerce hubs in 2023.

Over 700,000 Californians moved from the Golden State to other parts of U.S. between 2020–21. But where did they go?
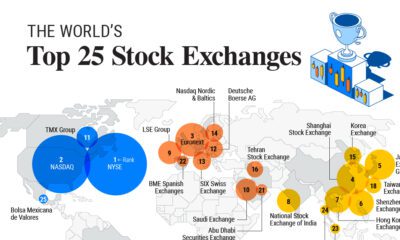

Here are the top 25 largest stock exchanges in the world, worth a combined $106 trillion in market capitalization in 2023.


 Creator Program