

This graphic shows the states with the highest real GDP growth rate in 2023, largely propelled by the oil and gas boom.
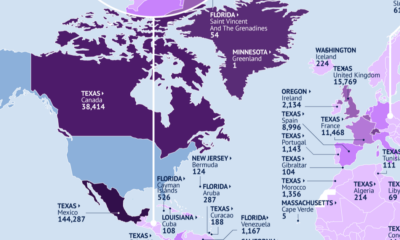

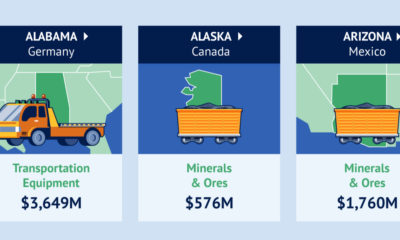
This map identifies the biggest U.S. export markets by state, showing the top partner of each country by value of goods imported.

Canada is the top destination for products from 21 states.
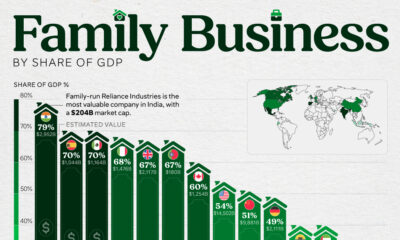

Family-owned businesses are key drivers of the global economy. This graphic shows their economic contribution to GDP, by country.


Which economies are expected to see interest rates rise, or fall? We highlight IMF forecasts for international interest rates through 2028.
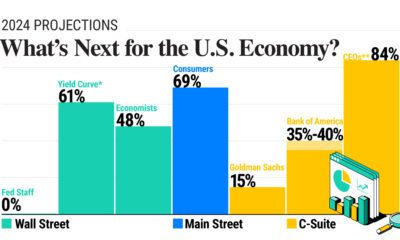

In this graphic, we show the probability of a U.S. recession in 2024, based on forecasts from Wall Street, Main Street, and the C-Suite.


How does each state contribute to America's overall GDP? This visualization breaks down the U.S. economy by state.
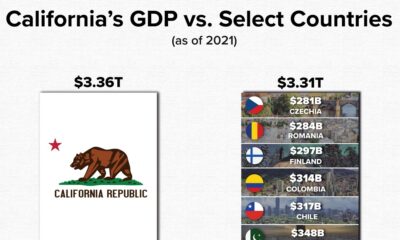

California’s GDP makes the state one of the most powerful economies in the world. This graphic compares it to the GDP of 10 select countries.
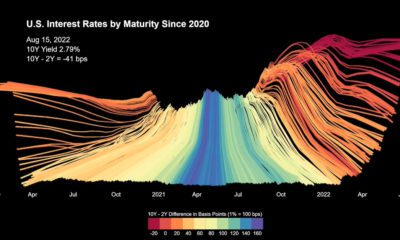

U.S. interest rates have risen sharply after sitting near historic lows. This animation charts their trajectory since 2020.
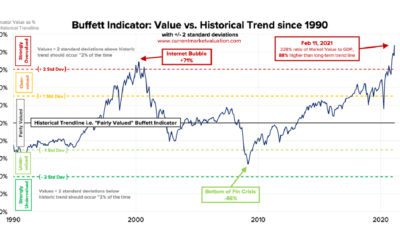

At 228%, the Buffett Indicator has reached all-time highs, which means America’s stock market value is currently more than double the country’s GDP.


 Creator Program