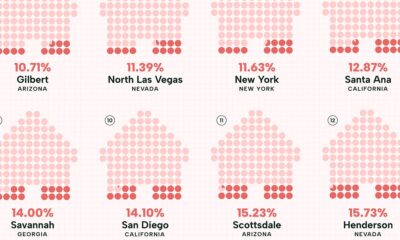

Visualizing the least affordable U.S. cities for renters by the percentage of affordable rentals available on an average salary.
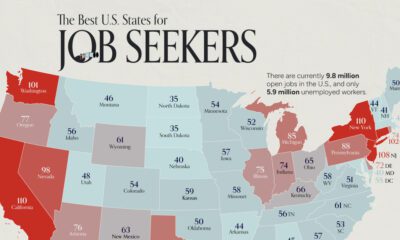

On average, there are 75 workers available for every 100 job openings across the country. Here's how it varies by state.


How does each state contribute to America's overall GDP? This visualization breaks down the U.S. economy by state.


This graphic compares the cost of living and purchasing power of 578 cities worldwide, using New York City as a benchmark for comparison.


The early 1800s were a time of rapid change in New York City. This map shows the city in 1836, alongside the modern day metropolis.
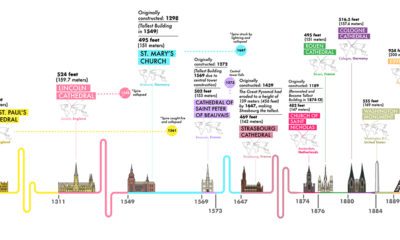

From the pyramids to the Eiffel Tower, our creations have scaled dramatically over the centuries. Which have been the world's tallest structures in history?


 Creator Program