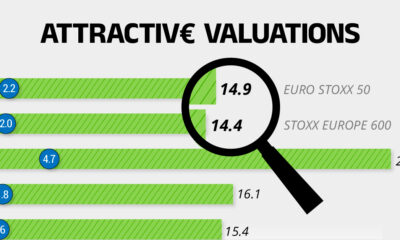

On average, the European stock market has valuations that are nearly 50% lower than U.S. valuations. But how can you access the market?
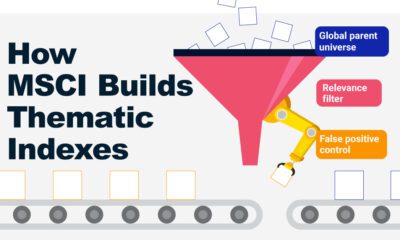

From developing an index objective to choosing relevant stocks, this graphic breaks down how MSCI builds thematic indexes using examples.
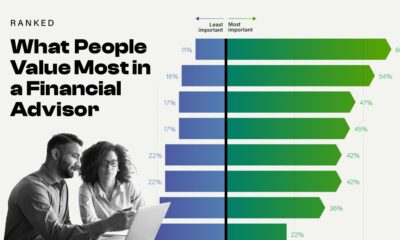

Positive reviews and recommendations are some of the least important factors—so what do people look for in a financial advisor?
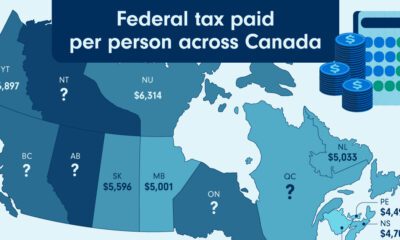

We show which provinces and territories pay the most and least tax after adjusting for the number of tax filers in each jurisdiction.
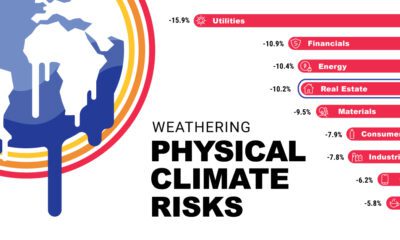

Physical hazards like fires pose climate risks for companies, due to the added costs of asset damage and business interruption.
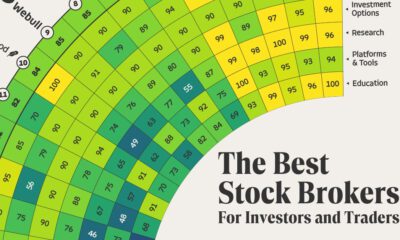

Whether you’re searching for low fees or an easy-to-use trading platform, this clear breakdown can help you find the best stock brokers.
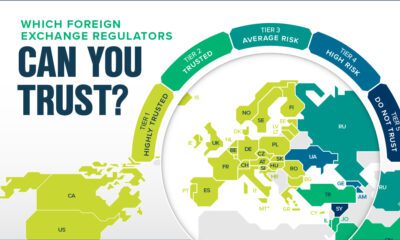

Some foreign exchange regulators have very strict regulations and enforcement, while others have few regulations—or none at all.
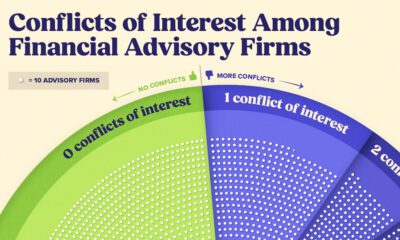

Financial advisors may not always act in your best interest. How common are conflicts of interest among U.S. firms?
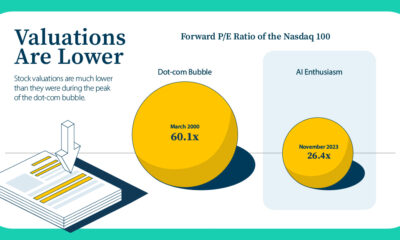

Valuations are much lower than they were during the dot-com bubble, but what else sets the current AI enthusiasm apart?
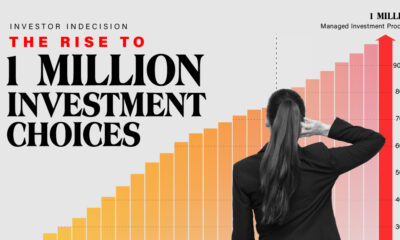

By 2031, there could be one million managed investment products. The rapid growth is leading to decision paralysis among investors.
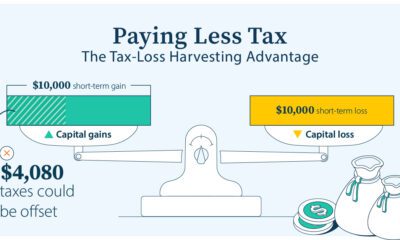

Learn how tax-loss harvesting works by using capital losses to offset capital gains, potentially reducing your tax bill.
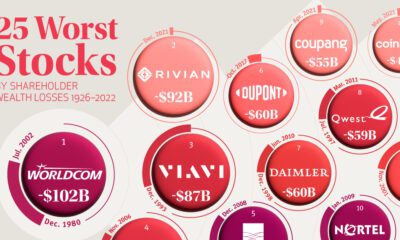

Among publicly-listed U.S. companies, the 25 worst stocks have lost shareholders a collective $1.2 trillion since 1926.
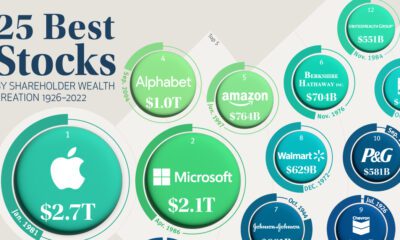

Accounting for just 0.1% of all public U.S. stocks, these companies have created nearly a third of all shareholder wealth since 1926.
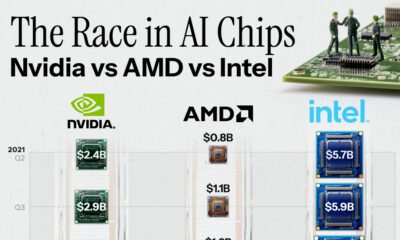

The generative AI boom is powered by processors. How have AI chip sales grown over the last two years among Nvidia vs AMD vs Intel?
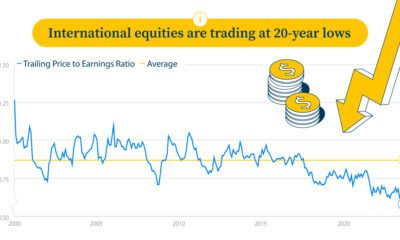

International stocks are trading at 20-year lows relative to U.S. stocks, which could present attractive buying opportunities for investors.
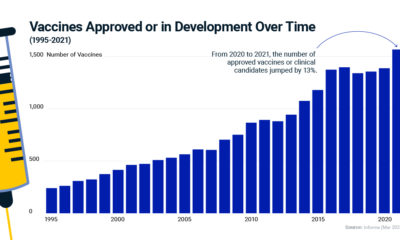

Vaccine development has grown six-fold since 1995. Learn how virology, the study of viruses, is driving innovation in the healthcare industry.


The highest one-year return among the top S&P 500 stocks from 1980 to 2022 was a staggering 2,620%. Which stocks top the ranks?


From sector performance to market recoveries, test your knowledge about investing during a recession with this interactive quiz.
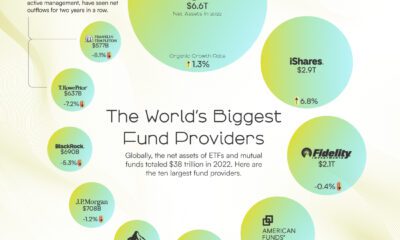

In 2022, the global net assets of mutual fund and ETF providers totaled $38 trillion. This chart shows the industry's biggest brands.
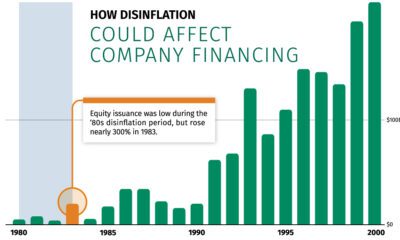

History signals that after a period of slowing inflation—also known as disinflation—debt and equity issuance expands.
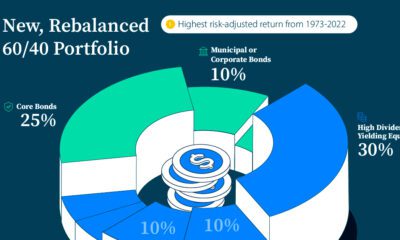

Amid uncertain economic times, a new allocation for the 60/40 portfolio may help investors target higher risk-adjusted returns.
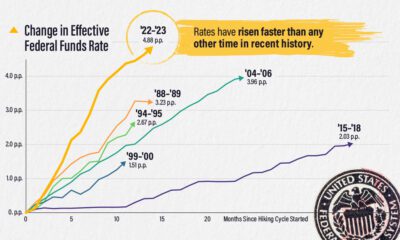

The effective federal funds rate has risen nearly five percentage points in 14 months, the fastest interest rate hikes in modern history.


How does the $6.1 billion Washington Commanders sale measure up against the most expensive sports team sales in history?


Can you picture what $31.4 trillion looks like? This graphic stacks up $1 bills to visualize U.S. debt in physical form.
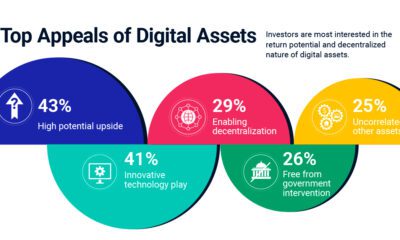

Digital assets are gaining popularity due to their return potential and decentralized nature. How can institutional investors get exposure?
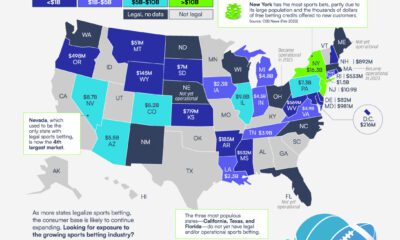

In 2022, legal sports betting in the U.S. totaled over $93 billion. Which states saw the most and least wagers? (Sponsored post)
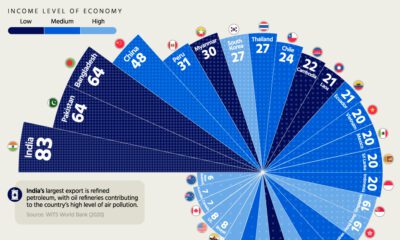

Which economies have hazy air, and which ones enjoy mostly clear skies? Find out in this geographic breakdown of air pollution levels.
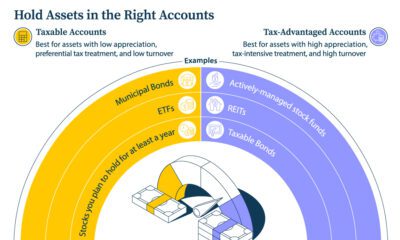

Learn five tax tips that may help maximize the after-tax value of your investments, including which assets may be best for certain accounts.
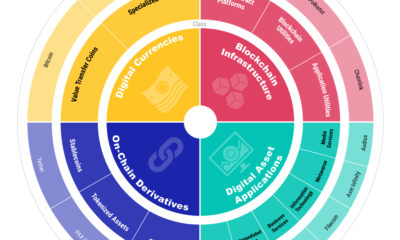

How can investors get clarity on the thousands of digital assets available? A new structure classifies digital assets by their use cases.
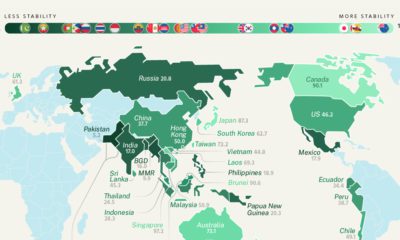

Prior to invading Ukraine, Russia had one of the highest levels of geopolitical risk. How does geopolitical uncertainty vary around the world?
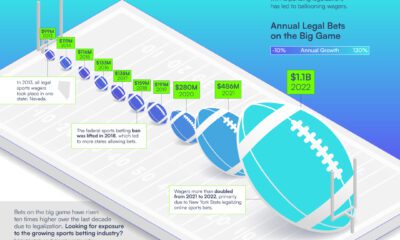

Expanding legalization has driven an increase in bets on football's big game, with wagers more than doubling from 2021 to 2022. (Sponsored Content)
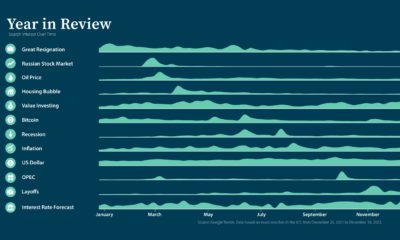

What was on investors' minds in 2022? Discover the top Google searches and how the dominant trends played out in portfolios.
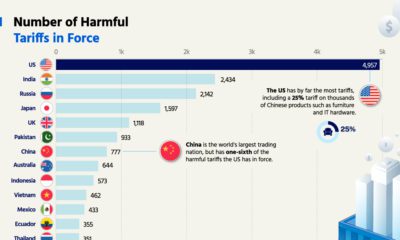

The U.S. has by far the most harmful tariffs, with nearly 5,000 in force. Which economy has the least tariffs?
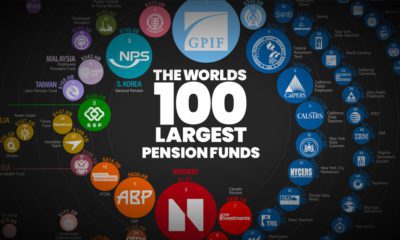

The world’s 100 largest pension funds are worth over $17 trillion in total. Which ones are the biggest, and where are they located?
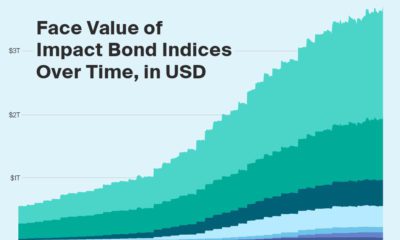

The face value of impact bond indices jumped by nearly 500% from 2018 to 2021. How do various types of sustainability indices help investors?
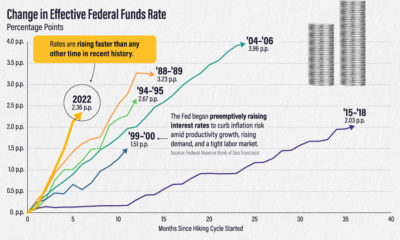

The effective federal funds rate has risen more than two percentage points in six months. How does this compare to other interest rate hikes?
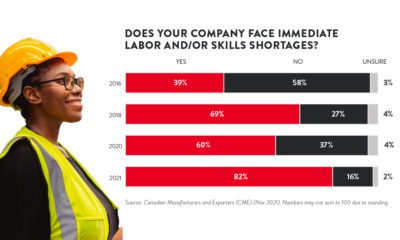

More than four in five manufacturers say they face an immediate skills or labor shortage. What steps can be taken to address the shortages?
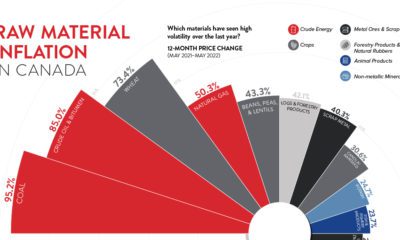

Over the last year, raw material inflation in Canada was 37%. Which material prices jumped the most, and how does this impact manufacturers?
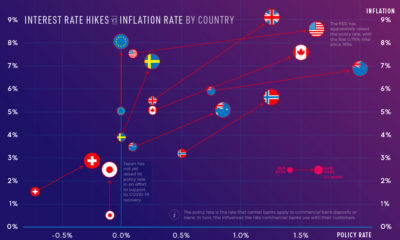

Inflation rates are reaching multi-decade highs in some countries. How aggressive have central banks been with interest rate hikes?
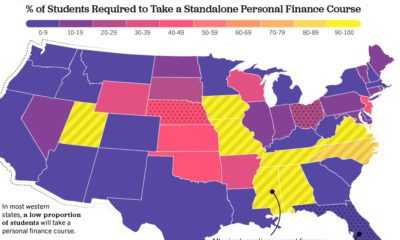

Only 22.7% of U.S. students are required to take a personal finance course. Which states have the highest levels of personal finance education?
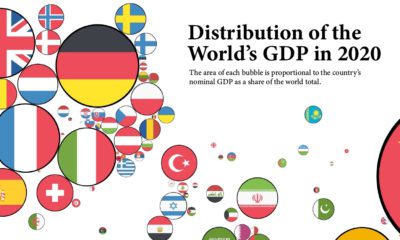

How have the world's largest economies changed over time? These graphics show countries sized by their GDP, as a share of the global total.
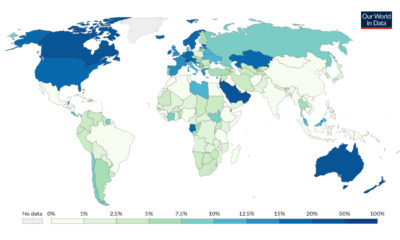

Immigrants account for 3.5% of the global population, but where are they more or less prevalent? This map shows immigration by country.
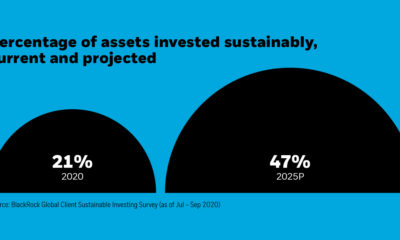

Investors plan to more than double their sustainable assets by 2025. What are the ESG challenges they face amid this shift?
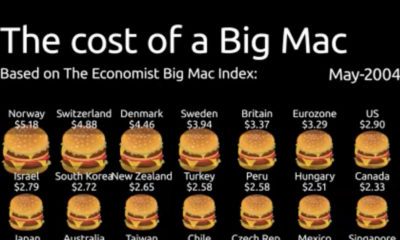

Spanning from 2004-2022, this animation of the Big Mac Index shows the rise in burger prices, and which currencies may be under or overvalued.
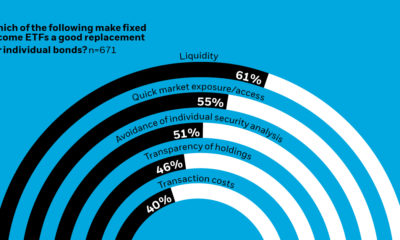

Fixed income ETFs are a go-to tool for institutional investors. Find out why professionals use them in this graphic.
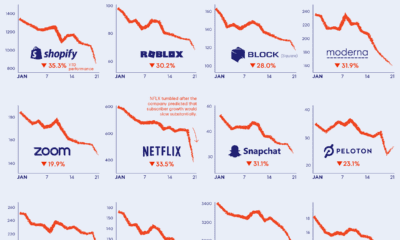

Worries over post-COVID demand and rising interest rates have fueled a market selloff, with pandemic stocks hit particularly hard.
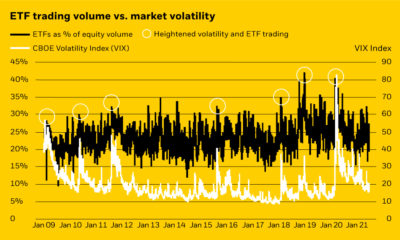

Historically, the trading volume of ETFs has spiked during market volatility. We explore why ETFs are preferred by institutional investors.
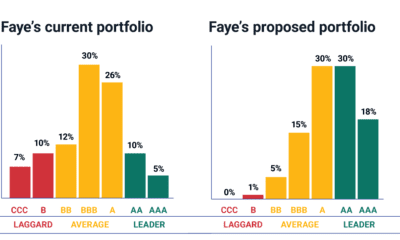

Wealth managers can use insights to improve the ESG qualities of their clients' financial portfolio, and improve their risk/return profile.
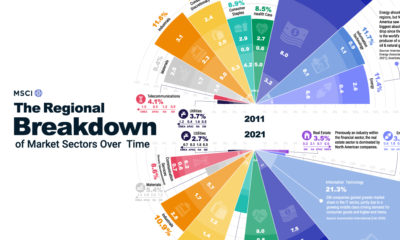

Did you know emerging markets gained market share in the technology sector? We show a regional breakdown of stock market sectors over time.
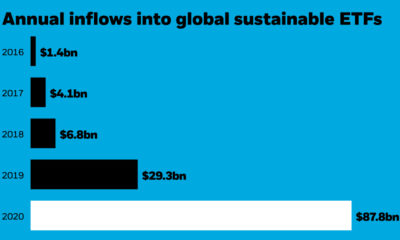

In 2020, inflows into sustainable ETFs were 63x higher than in 2016. We show how investors can implement climate investing in their portfolio.