How Sustainability Indices Can Support the Global ESG Push

How Sustainability Indices Can Support the Global ESG Push
The rise of sustainable investing has been fueled by a growing awareness of environmental, social, and governance (ESG) issues.
Alongside this, many investors want to have a positive impact. The issuance of impact bonds—where proceeds are used for a specific social or green cause—rose by 58% from 2020 to 2021.
Sustainability indices play a key role in the market, helping investors and portfolio managers benchmark performance and create new ESG investment products.
In this graphic from ICE, the last in a three-part series on the ESG toolkit, we explore the different types of ICE Sustainability Indices.
1. Green, Social, and Sustainable Bond Indices
What they do: Track bonds that promote climate change mitigation or that aim for positive social outcomes, such as reduced poverty levels.
Investors can also access sub-indices that track debt in specific currencies, or that cater to different risk appetites via investment grade or high yield bonds.
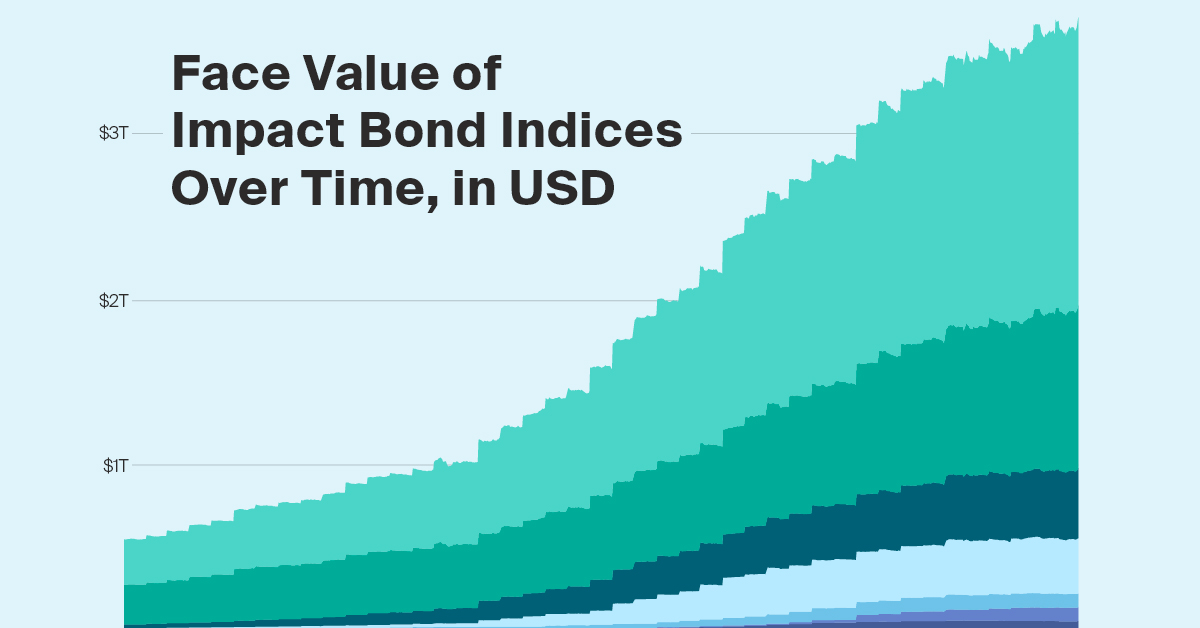
The face value of many of these sustainability indices has grown considerably in recent years.
| Index | Dec 2018 | Dec 2020 | Jul 2022 |
|---|---|---|---|
| ICE Green, Social, and Sustainability Bond Index | $272B | $972B | $1.7T |
| ICE BofA Green Bond Index | $240B | $572B | $980B |
| ICE Sustainable Bond Index | $23B | $233B | $421B |
| ICE Social Bond Index | $11B | $167B | $333B |
| ICE Global High Yield Green, Social & Sustainable Bond Index | $6B | $29B | $84B |
| ICE Sustainability Linked Bond Index | - | $4B | $82B |
| ICE Global High Yield Green Bond Index | $6B | $26B | $66B |
Face value, also referred to as par value, is the dollar amount the issuer pays to the investor at maturity. It is fixed, whereas the price of a bond can fluctuate over time based on supply and demand forces.
2. Corporate ESG Indices
What they do: Filter out bonds of companies with certain business involvement, and weight towards companies with better ESG risk scores.
There are 3 main approaches:
- ESG Tilt: Filter out companies with significant involvement in controversial weapons and weight remaining constituents towards those with lower ESG risk scores.
- ESG Tilt With Duration Match: Mirror the ESG tilt method, but adjust to match the Parent Index’s interest rate exposure across rating and sector segments.
- ESG Best-In-Class*: Filter out companies with significant involvement in controversial weapons and/or that have the highest ESG risk scores. The remaining constituents are weighted to match the rating and sector allocations of the Parent Index.
*Best-in-Class refers to an approach used to identify companies with strong ESG ratings within their respective sectors.
These sustainability indices have lower risk scores than their parent indices, which are not ESG focused. For instance, U.S. High Yield Indices had at least 20% lower ESG risk scores than the associated parent index.
3. Climate Transition and Paris-Aligned Indices
What they do: Help investors pursue low carbon investment strategies, decarbonize their asset allocation and increase transparency.
ICE has a series of corporate bond indices that reduce the aggregate carbon exposure of their securities on a trajectory toward net zero by the end of 2050. The series includes versions that are subject to the requirements for labeling as Paris Aligned Benchmarked and Climate Transition Benchmarks, under EU and UK Benchmarks Regulation.
| Minimum Standards | Climate Transition Indices | Paris-Aligned Indices | |
|---|---|---|---|
| Climate Scenario | 1.5°C by 2050 | 1.5°C by 2050 | |
| Decarbonization Trajectory | 7% reduction per year | 7% reduction per year | |
| Minimum Scope 1, 2 & 3 Carbon Reduction vs Parent Index | 30% | 50% | |
| Baseline Exclusions | - Controversial weapons -Tobacco - Violators of the UNGC Principles - Companies that significantly harm one or more of the environmental objectives of the EU Taxonomy Regulation | - Controversial weapons -Tobacco - Violators of the UNGC Principles - Companies that significantly harm one or more of the environmental objectives of the EU Taxonomy Regulation | |
| Activity Exclusions | No | Fossil fuels |
The two types of sustainability indices have very similar minimum standards. However, Paris-Aligned Benchmarks have a higher decarbonization trajectory and exclude fossil fuels.
4. Global Carbon Future Indices
What they do: Track the price of carbon using some of the most actively traded carbon markets in the world. This includes the EU Emissions Trading Scheme, the Western Climate Initiative, the Regional Greenhouse Gas Initiative, and the UK Emissions Trading Scheme.
Tracking the price of carbon helps various groups:
- Policymakers can design policy accordingly
- Emitters and traders can hedge exposure to the rising price of carbon
- ETF providers can create investable funds based off a carbon index
The ICE Global Carbon Futures Index has historically outperformed several asset classes.
| Asset Class | Cumulative Total Return, Dec 2013-Jun 2022 |
|---|---|
| Global Carbon Futures | 729% |
| U.S. Equities | 143% |
| Precious Metals Futures | 36% |
| U.S. Investment Grade Bonds | 18% |
| Energy Futures | -10% |
See graphic for specific indices used.
The cumulative return of Global Carbon Futures was more than double that of other asset classes, and it also had the strongest risk-adjusted return.
Sustainability Indices: Helping ESG Investing Flourish
As the demand for ESG investments rises, so will the need for benchmarks that support the creation and management of portfolios.
A broad suite of sustainability indices will help investors:
- Promote climate change mitigation
- Aim for positive social outcomes
- Filter out certain business involvement
- Overweight companies with better ESG risk scores
- Pursue low carbon investment strategies
- Track the price of carbon
Backed with a rigorous methodology and detailed ESG data, these sustainability indices make ESG strategies actionable.
To explore ICE’s broad range of sustainability indices, click here now.

-

 Green1 week ago
Ranking the Top 15 Countries by Carbon Tax Revenue
This graphic highlights France and Canada as the global leaders when it comes to generating carbon tax revenue.
-

 Green1 week ago
Ranked: The Countries With the Most Air Pollution in 2023
South Asian nations are the global hotspot for pollution. In this graphic, we rank the world’s most polluted countries according to IQAir.
-

 Environment2 weeks ago
Top Countries By Forest Growth Since 2001
One country is taking reforestation very seriously, registering more than 400,000 square km of forest growth in two decades.
-

 Green3 weeks ago
Ranked: Top Countries by Total Forest Loss Since 2001
The country with the most forest loss since 2001 lost as much forest cover as the next four countries combined.
-

 Markets2 months ago
The World’s Top Cocoa Producing Countries
Here are the largest cocoa producing countries globally—from Côte d’Ivoire to Brazil—as cocoa prices hit record highs.
-

 Environment2 months ago
Charted: Share of World Forests by Country
We visualize which countries have the biggest share of world forests by area—and while country size plays a factor, so too, does the environment.


