Markets
The 25 Worst Stocks by Shareholder Wealth Losses (1926-2022)
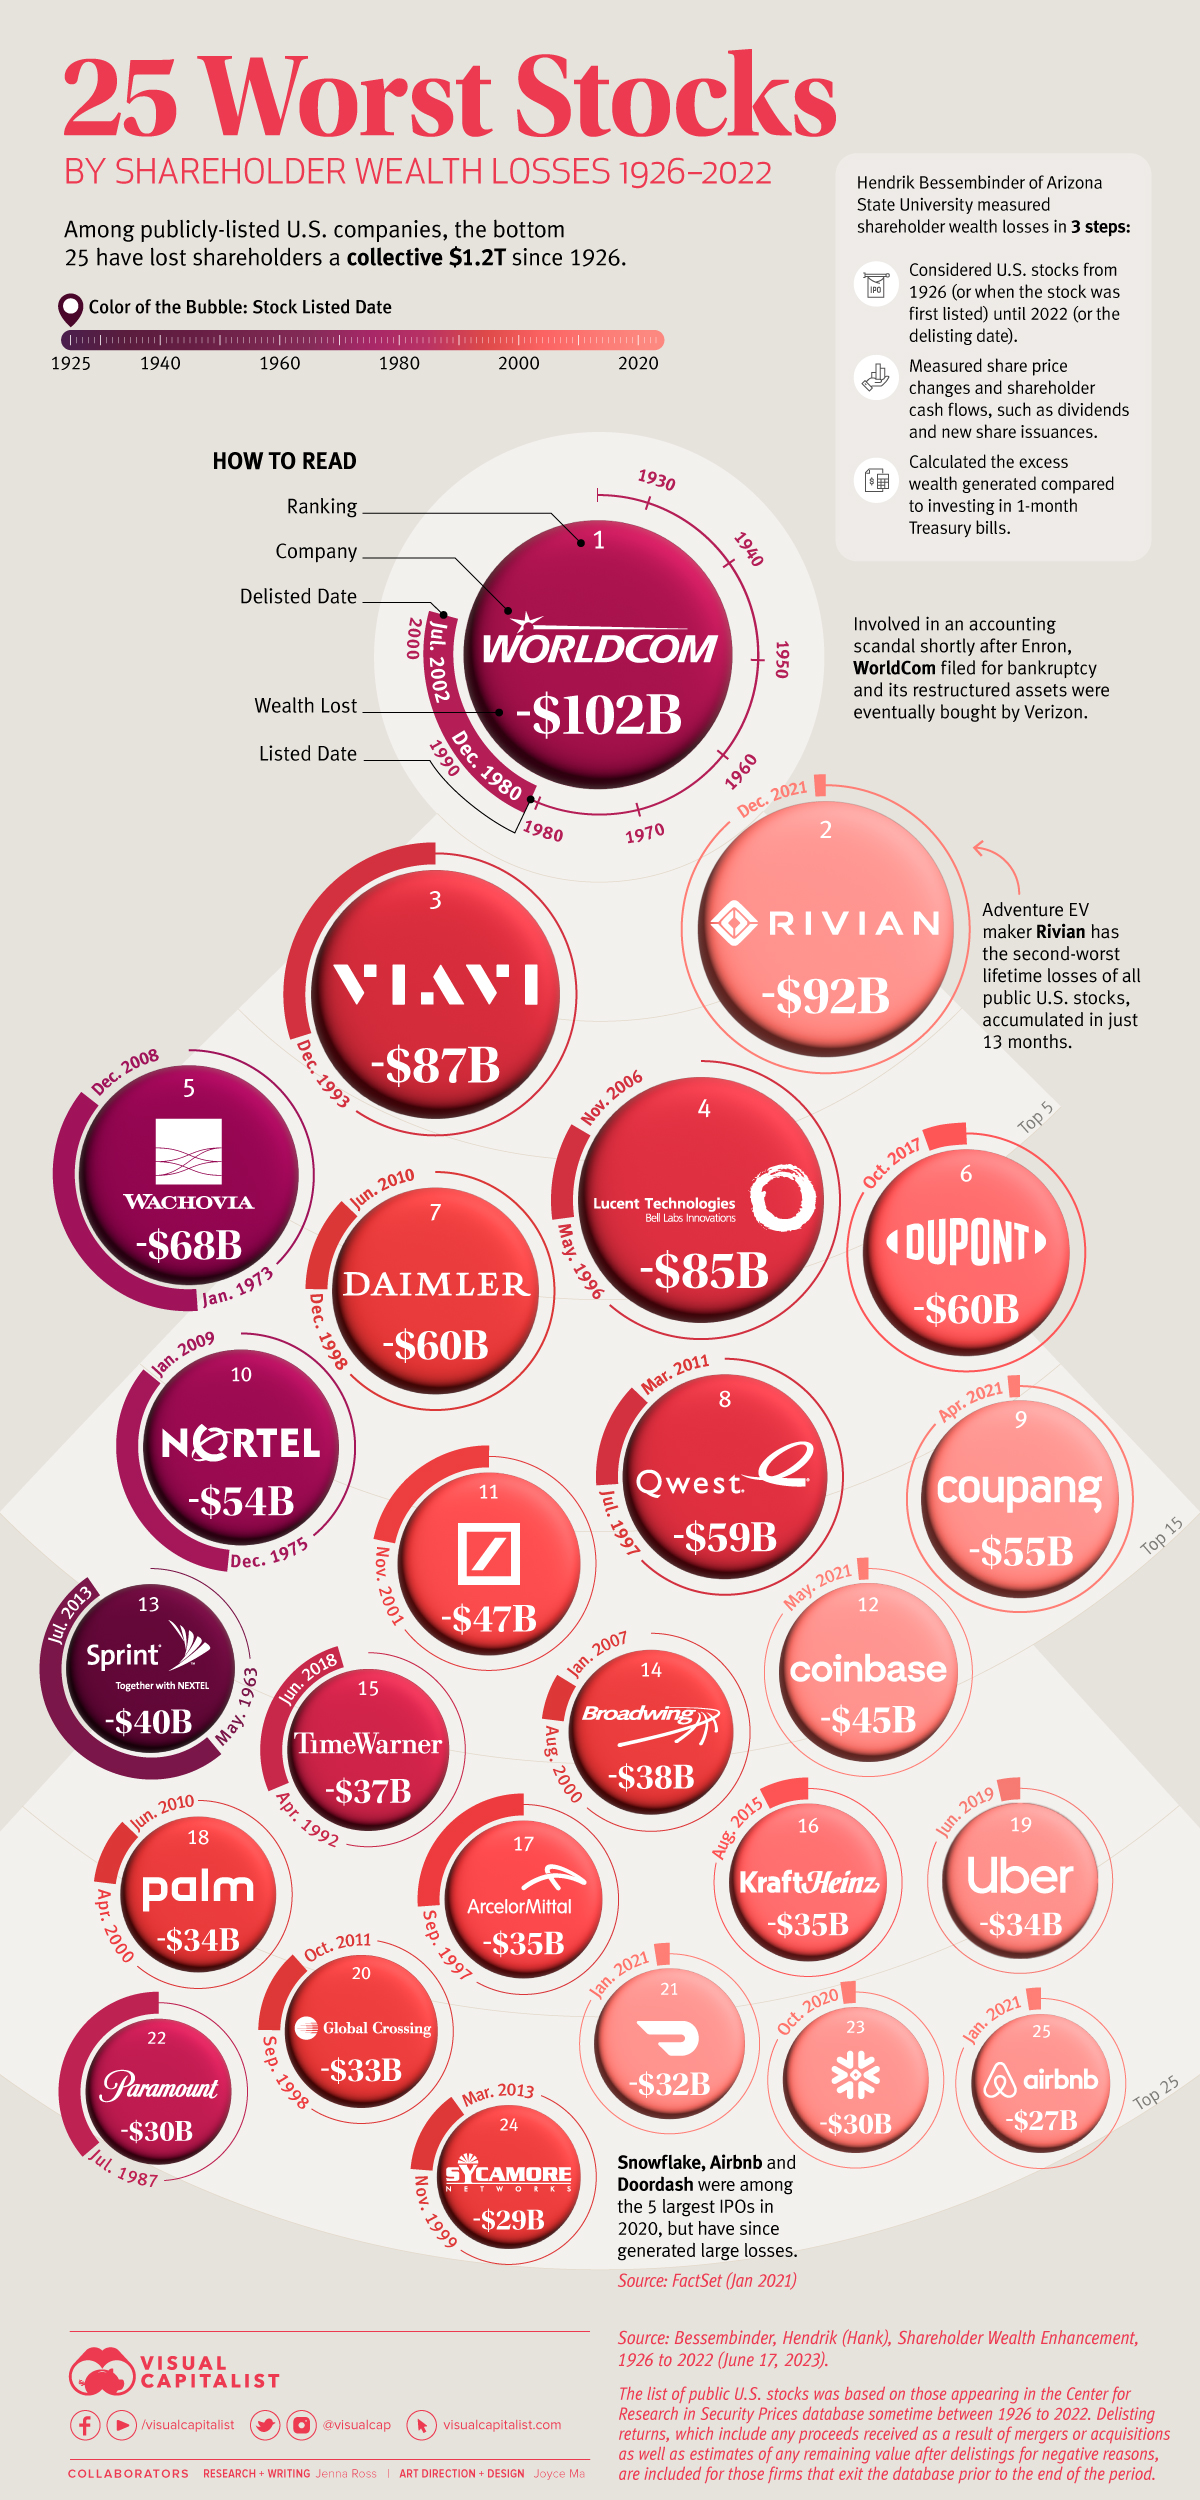
The 25 Worst Stocks by Shareholder Wealth Losses (1926-2022)
Among publicly-listed U.S. companies, the 25 worst stocks have lost shareholders a collective $1.2 trillion since 1926. Put another way, just 0.1% of all stocks have led to 14% of all cumulative losses in shareholder wealth.
In this graphic, we use data from Henrik Bessembinder of Arizona State University to show the worst stocks of the last century.
How Are Shareholder Wealth Losses Calculated?
Bessembinder took three steps to measure lifetime shareholder wealth losses:
- Considered U.S. stocks in the Center for Research in Security Prices database from 1926 (or when the stock was first listed) until 2022 (or when the stock was delisted).
- Measured share price changes as well as cash flows to/from shareholders including dividends, spinoffs, share buybacks, and new share issuances.
- Calculated the excess wealth generated compared to investing in one-month Treasury bills over the same time period.
If a company exited the database during the period, Bessembinder calculated its delisting return based on any proceeds from mergers or acquisitions as well as estimates of any remaining value after delistings for negative reasons.
The 25 Worst Stocks in Modern History
With this context in mind, here are the worst stocks since 1926.
| Rank | Company | Lifetime Wealth Losses | First Month | Last Month |
|---|---|---|---|---|
| 1 | WORLDCOM | -$102B | Dec‐80 | Jul‐02 |
| 2 | RIVIAN AUTOMOTIVE | -$92B | Dec‐21 | Dec‐22 |
| 3 | VIAVI SOLUTIONS | -$87B | Dec‐93 | Dec‐22 |
| 4 | LUCENT TECHNOLOGIES | -$85B | May‐96 | Nov‐06 |
| 5 | WACHOVIA | -$68B | Jan‐73 | Dec‐08 |
| 6 | DUPONT DE NEMOURS | -$60B | Oct‐17 | Dec‐22 |
| 7 | DAIMLER | -$60B | Dec‐98 | Jun‐10 |
| 8 | QWEST COMMUNICATIONS INTL | -$59B | Jul‐97 | Mar‐11 |
| 9 | COUPANG | -$55B | Apr‐21 | Dec‐22 |
| 10 | NORTEL NETWORKS | -$54B | Dec‐75 | Jan‐09 |
| 11 | DEUTSCHE BANK | -$47B | Nov‐01 | Dec‐22 |
| 12 | COINBASE | -$45B | May‐21 | Dec‐22 |
| 13 | SPRINT NEXTEL | -$40B | May‐63 | Jul‐13 |
| 14 | BROADWING | -$38B | Aug‐00 | Jan‐07 |
| 15 | TIME WARNER | -$37B | Apr‐92 | Jun‐18 |
| 16 | KRAFT HEINZ | -$35B | Aug‐15 | Dec‐22 |
| 17 | ARCELORMITTAL SA LUXEMBOURG | -$35B | Sep‐97 | Dec‐22 |
| 18 | PALM | -$34B | Apr‐00 | Jun‐10 |
| 19 | UBER | -$34B | Jun‐19 | Dec‐22 |
| 20 | GLOBAL CROSSING | -$33B | Sep‐98 | Oct‐11 |
| 21 | DOORDASH | -$32B | Jan‐21 | Dec‐22 |
| 22 | PARAMOUNT | -$30B | Jul‐87 | Dec‐22 |
| 23 | SNOWFLAKE | -$30B | Oct‐20 | Dec‐22 |
| 24 | SYCAMORE NETWORKS | -$29B | Nov‐99 | Mar‐13 |
| 25 | AIRBNB | -$27B | Jan‐21 | Dec‐22 |
WorldCom, number one on the list, was a long-distance phone provider and handled internet data. In response to a surplus of telecommunications capacity that reduced pricing power, WorldCom began “cooking its books” to meet growth targets.
An SEC investigation of the accounting scandal found that executives improperly reduced costs by more than $7 billion and exaggerated revenue by at least $958 million. Once the fraud was discovered, WorldCom filed for the largest bankruptcy filing in American history as of July 2002.
Some of the worst stocks by lifetime wealth losses have gone public within the last few years. For instance, Doordash was one of the largest IPOs in 2020, with investor enthusiasm driving its share price 86% higher in the first day. The company has seen its revenue and U.S. market share increase, but it has yet to produce a 12-month profit.
Common Threads
Among the worst-performing stocks, there are some patterns. For instance, eight of the 25 stocks on this list belong to the telecommunications industry. Like WorldCom, many of these companies also engaged in accounting fraud to inflate their financial results.
Financial fraud can be hard to detect, but investors can look for potential red flags such as consistent sales growth while competitors are struggling. The SEC noted in its WorldCom investigation that “WorldCom claimed it was successfully managing industry trends that were hurting all of its competitors”.
Another commonality among some of the worst stocks was the hype around their IPOs. High valuations that are not supported by profitability may lead to large shareholder losses.


Markets
The European Stock Market: Attractive Valuations Offer Opportunities
On average, the European stock market has valuations that are nearly 50% lower than U.S. valuations. But how can you access the market?


European Stock Market: Attractive Valuations Offer Opportunities
Europe is known for some established brands, from L’Oréal to Louis Vuitton. However, the European stock market offers additional opportunities that may be lesser known.
The above infographic, sponsored by STOXX, outlines why investors may want to consider European stocks.
Attractive Valuations
Compared to most North American and Asian markets, European stocks offer lower or comparable valuations.
| Index | Price-to-Earnings Ratio | Price-to-Book Ratio |
|---|---|---|
| EURO STOXX 50 | 14.9 | 2.2 |
| STOXX Europe 600 | 14.4 | 2 |
| U.S. | 25.9 | 4.7 |
| Canada | 16.1 | 1.8 |
| Japan | 15.4 | 1.6 |
| Asia Pacific ex. China | 17.1 | 1.8 |
Data as of February 29, 2024. See graphic for full index names. Ratios based on trailing 12 month financials. The price to earnings ratio excludes companies with negative earnings.
On average, European valuations are nearly 50% lower than U.S. valuations, potentially offering an affordable entry point for investors.
Research also shows that lower price ratios have historically led to higher long-term returns.
Market Movements Not Closely Connected
Over the last decade, the European stock market had low-to-moderate correlation with North American and Asian equities.
The below chart shows correlations from February 2014 to February 2024. A value closer to zero indicates low correlation, while a value of one would indicate that two regions are moving in perfect unison.
| EURO STOXX 50 | STOXX EUROPE 600 | U.S. | Canada | Japan | Asia Pacific ex. China |
|
|---|---|---|---|---|---|---|
| EURO STOXX 50 | 1.00 | 0.97 | 0.55 | 0.67 | 0.24 | 0.43 |
| STOXX EUROPE 600 | 1.00 | 0.56 | 0.71 | 0.28 | 0.48 | |
| U.S. | 1.00 | 0.73 | 0.12 | 0.25 | ||
| Canada | 1.00 | 0.22 | 0.40 | |||
| Japan | 1.00 | 0.88 | ||||
| Asia Pacific ex. China | 1.00 |
Data is based on daily USD returns.
European equities had relatively independent market movements from North American and Asian markets. One contributing factor could be the differing sector weights in each market. For instance, technology makes up a quarter of the U.S. market, but health care and industrials dominate the broader European market.
Ultimately, European equities can enhance portfolio diversification and have the potential to mitigate risk for investors.
Tracking the Market
For investors interested in European equities, STOXX offers a variety of flagship indices:
| Index | Description | Market Cap |
|---|---|---|
| STOXX Europe 600 | Pan-regional, broad market | €10.5T |
| STOXX Developed Europe | Pan-regional, broad-market | €9.9T |
| STOXX Europe 600 ESG-X | Pan-regional, broad market, sustainability focus | €9.7T |
| STOXX Europe 50 | Pan-regional, blue-chip | €5.1T |
| EURO STOXX 50 | Eurozone, blue-chip | €3.5T |
Data is as of February 29, 2024. Market cap is free float, which represents the shares that are readily available for public trading on stock exchanges.
The EURO STOXX 50 tracks the Eurozone’s biggest and most traded companies. It also underlies one of the world’s largest ranges of ETFs and mutual funds. As of November 2023, there were €27.3 billion in ETFs and €23.5B in mutual fund assets under management tracking the index.
“For the past 25 years, the EURO STOXX 50 has served as an accurate, reliable and tradable representation of the Eurozone equity market.”
— Axel Lomholt, General Manager at STOXX
Partnering with STOXX to Track the European Stock Market
Are you interested in European equities? STOXX can be a valuable partner:
- Comprehensive, liquid and investable ecosystem
- European heritage, global reach
- Highly sophisticated customization capabilities
- Open architecture approach to using data
- Close partnerships with clients
- Part of ISS STOXX and Deutsche Börse Group
With a full suite of indices, STOXX can help you benchmark against the European stock market.
Learn how STOXX’s European indices offer liquid and effective market access.

-

 Economy2 days ago
Economic Growth Forecasts for G7 and BRICS Countries in 2024
The IMF has released its economic growth forecasts for 2024. How do the G7 and BRICS countries compare?
-

 Markets1 week ago
U.S. Debt Interest Payments Reach $1 Trillion
U.S. debt interest payments have surged past the $1 trillion dollar mark, amid high interest rates and an ever-expanding debt burden.
-

 United States2 weeks ago
Ranked: The Largest U.S. Corporations by Number of Employees
We visualized the top U.S. companies by employees, revealing the massive scale of retailers like Walmart, Target, and Home Depot.
-

 Markets2 weeks ago
The Top 10 States by Real GDP Growth in 2023
This graphic shows the states with the highest real GDP growth rate in 2023, largely propelled by the oil and gas boom.
-

 Markets2 weeks ago
Ranked: The World’s Top Flight Routes, by Revenue
In this graphic, we show the highest earning flight routes globally as air travel continued to rebound in 2023.
-

 Markets3 weeks ago
Ranked: The Most Valuable Housing Markets in America
The U.S. residential real estate market is worth a staggering $47.5 trillion. Here are the most valuable housing markets in the country.


-

 Education1 week ago
How Hard Is It to Get Into an Ivy League School?
-

 Technology2 weeks ago
Ranked: Semiconductor Companies by Industry Revenue Share
-
Markets2 weeks ago
Ranked: The World’s Top Flight Routes, by Revenue
-

 Demographics2 weeks ago
Population Projections: The World’s 6 Largest Countries in 2075
-
Markets2 weeks ago
The Top 10 States by Real GDP Growth in 2023
-

 Demographics2 weeks ago
The Smallest Gender Wage Gaps in OECD Countries
-

 Economy2 weeks ago
Where U.S. Inflation Hit the Hardest in March 2024
-

 Green2 weeks ago
Top Countries By Forest Growth Since 2001