Finance
Companies Gone Public in 2021: Visualizing IPO Valuations


Companies Gone Public in 2021: Visualizing Valuations
Despite its many tumultuous turns, last year was a productive year for global markets, and companies going public in 2021 benefited.
From much-hyped tech initial public offerings (IPOs) to food and healthcare services, many companies with already large followings have gone public this year. Some were supposed to go public in 2020 but got delayed due to the pandemic, and others saw the opportunity to take advantage of a strong current market.
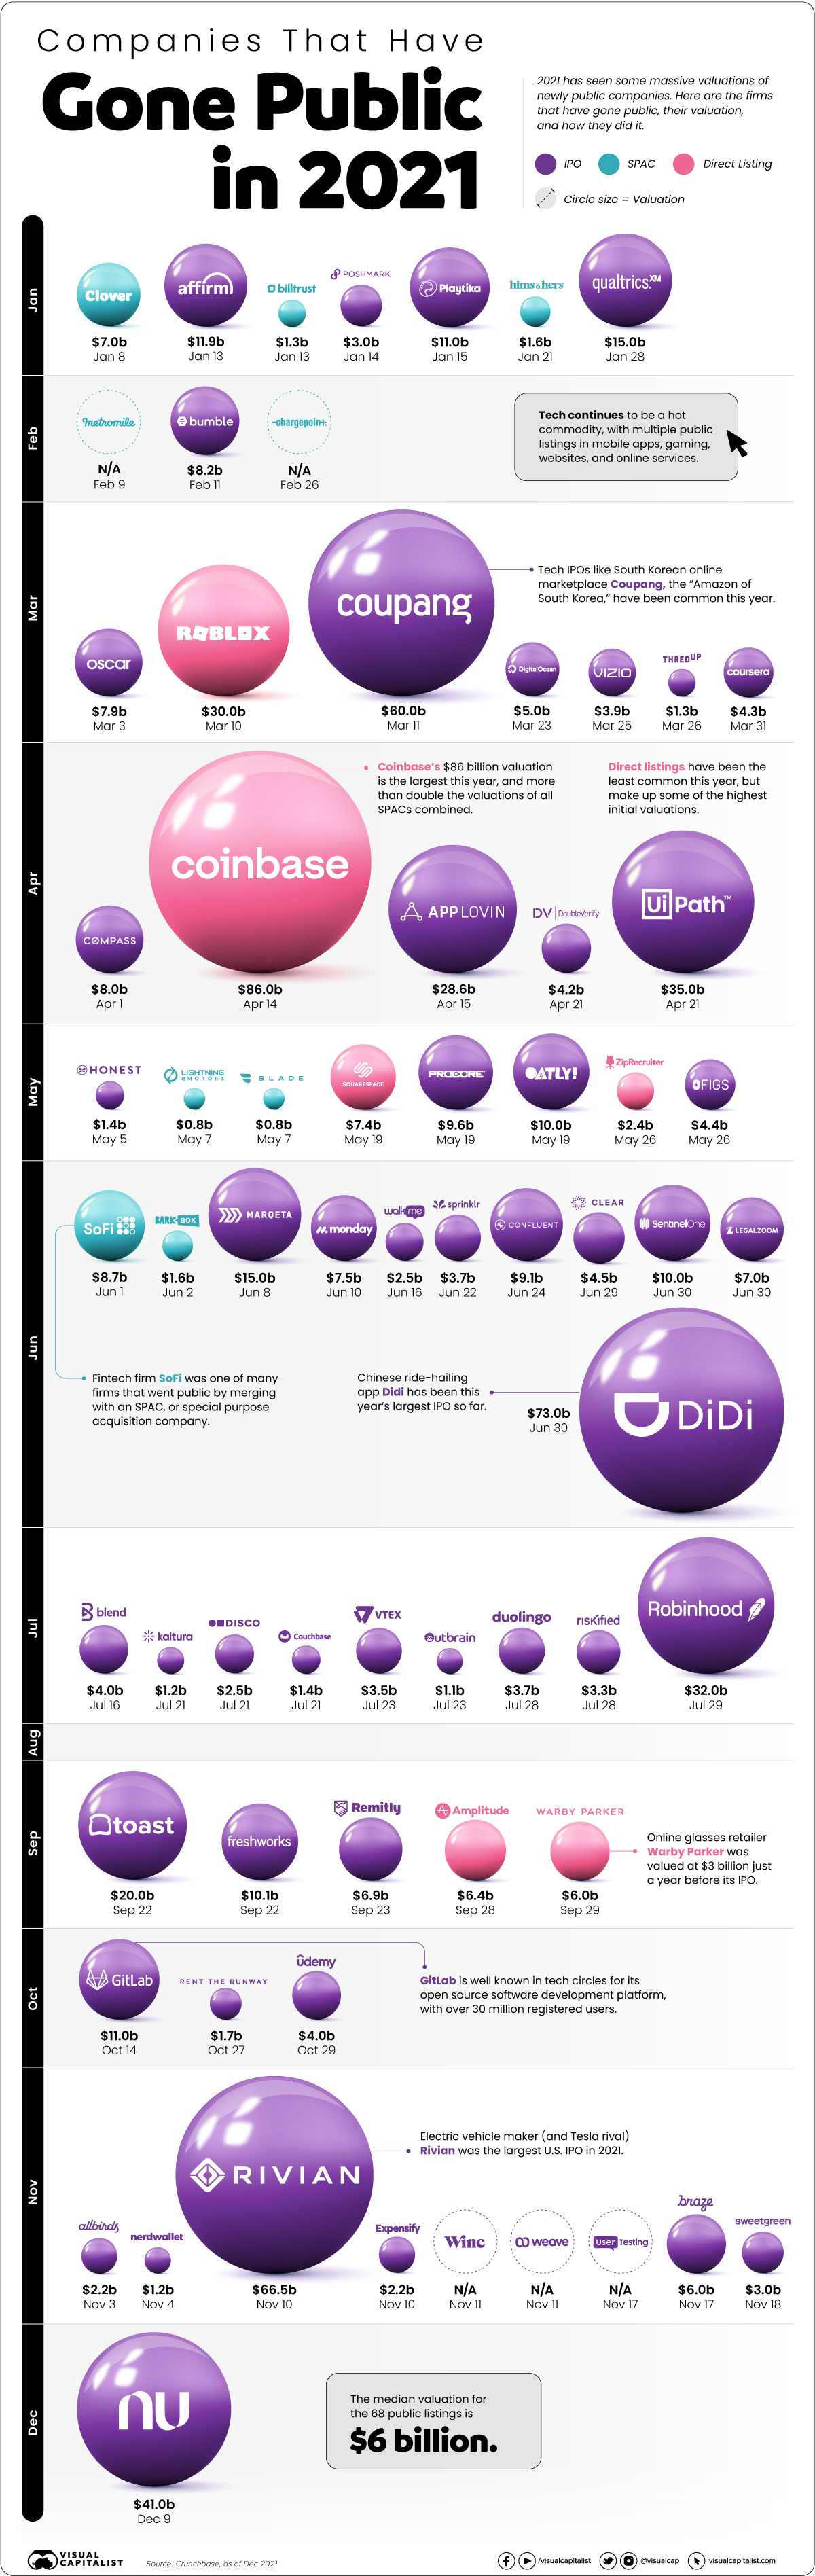
This graphic measures 68 companies that have gone public in 2021 — including IPOs, SPACs, and Direct Listings—as well as their subsequent valuations after listing.
Who’s Gone Public in 2021?
Historically, companies that wanted to go public employed one main method above others: the initial public offering (IPO).
But companies going public today readily choose from one of three different options, depending on market situations, associated costs, and shareholder preference:
- Initial Public Offering (IPO): A private company creates new shares which are underwritten by a financial organization and sold to the public.
- Special Purpose Acquisition Company (SPAC): A separate company with no operations is created strictly to raise capital to acquire the company going public. SPACs are the fastest method of going public, and have become popular in recent years.
- Direct Listing: A private company enters a market with only existing, outstanding shares being traded and no new shares created. The cost is lower than that of an IPO, since no fees need to be paid for underwriting.
The majority of companies going public in 2021 chose the IPO route, but some of the biggest valuations resulted from direct listings.
| Listing Date | Company | Valuation ($B) | Listing Type |
|---|---|---|---|
| 08-Jan-21 | Clover Health | $7.0 | SPAC |
| 13-Jan-21 | Affirm | $11.9 | IPO |
| 13-Jan-21 | Billtrust | $1.3 | SPAC |
| 14-Jan-21 | Poshmark | $3.0 | IPO |
| 15-Jan-21 | Playtika | $11.0 | IPO |
| 21-Jan-21 | Hims and Hers Health | $1.6 | SPAC |
| 28-Jan-21 | Qualtrics | $15.0 | IPO |
| 09-Feb-21 | Metromile | - | SPAC |
| 11-Feb-21 | Bumble | $8.2 | IPO |
| 26-Feb-21 | ChargePoint Holdings | - | SPAC |
| 03-Mar-21 | Oscar Health | $7.9 | IPO |
| 10-Mar-21 | Roblox | $30.0 | Direct Listing |
| 11-Mar-21 | Coupang | $60.0 | IPO |
| 23-Mar-21 | DigitalOcean | $5.0 | IPO |
| 25-Mar-21 | VIZIO | $3.9 | IPO |
| 26-Mar-21 | ThredUp | $1.3 | IPO |
| 31-Mar-21 | Coursera | $4.3 | IPO |
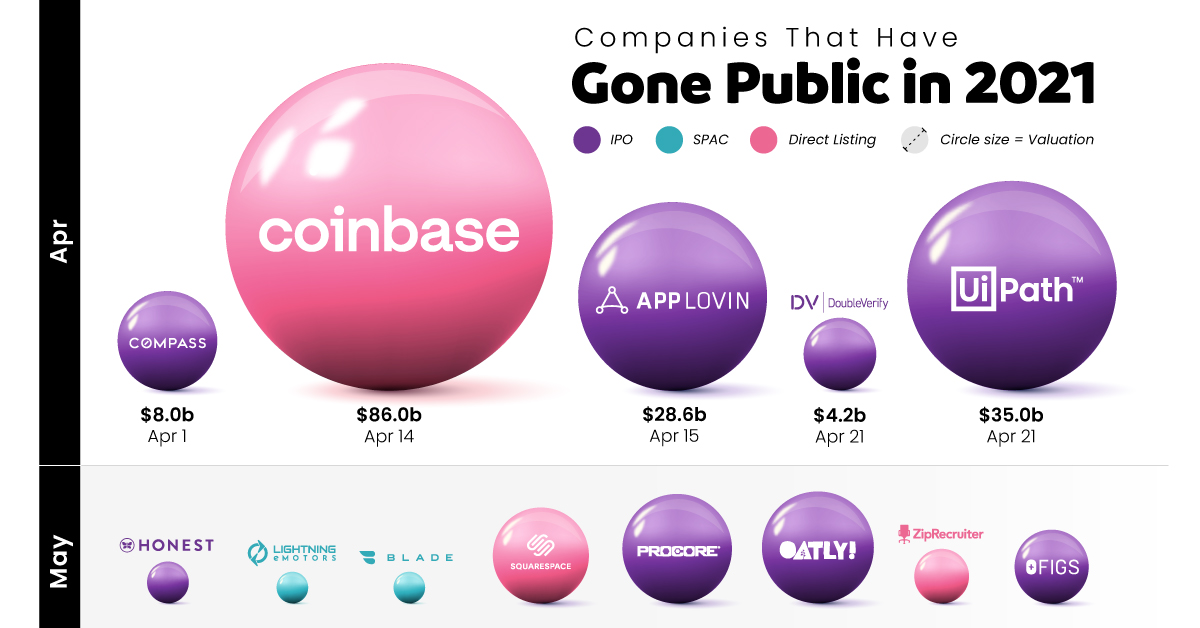
| 01-Apr-21 | Compass | $8.0 | IPO |
| 14-Apr-21 | Coinbase | $86.0 | Direct Listing |
| 15-Apr-21 | AppLovin | $28.6 | IPO |
| 21-Apr-21 | UiPath | $35.0 | IPO |
| 21-Apr-21 | DoubleVerify | $4.2 | IPO |
| 05-May-21 | The Honest Company | $1.4 | IPO |
| 07-May-21 | Lightning eMotors | $0.82 | SPAC |
| 07-May-21 | Blade Air Mobility | $0.83 | SPAC |
| 19-May-21 | Squarespace | $7.4 | Direct Listing |
| 19-May-21 | Procore | $9.6 | IPO |
| 19-May-21 | Oatly | $10.0 | IPO |
| 26-May-21 | ZipRecruiter | $2.4 | Direct Listing |
| 26-May-21 | FIGS | $4.4 | IPO |
| 01-Jun-21 | SoFi | $8.7 | SPAC |
| 02-Jun-21 | BarkBox | $1.6 | SPAC |
| 08-Jun-21 | Marqueta | $15.0 | IPO |
| 10-Jun-21 | Monday.com | $7.5 | IPO |
| 16-Jun-21 | WalkMe | $2.5 | IPO |
| 22-Jun-21 | Sprinklr | $3.7 | IPO |
| 24-Jun-21 | Confluent | $9.1 | IPO |
| 29-Jun-21 | Clear | $4.5 | IPO |
| 30-Jun-21 | SentinelOne | $10.0 | IPO |
| 30-Jun-21 | LegalZoom | $7.0 | IPO |
| 30-Jun-21 | Didi Chuxing | $73.0 | IPO |
| 16-Jul-21 | Blend | $4 | IPO |
| 21-Jul-21 | Kaltura | $1.24 | IPO |
| 21-Jul-21 | DISCO | $2.5 | IPO |
| 21-Jul-21 | Couchbase | $1.4 | IPO |
| 23-Jul-21 | Vtex | $3.5 | IPO |
| 23-Jul-21 | Outbrain | $1.1 | IPO |
| 28-Jul-21 | Duolingo | $3.7 | IPO |
| 28-Jul-21 | Riskified | $3.3 | IPO |
| 29-Jul-21 | Robinhood | $32.0 | IPO |
| 22-Sep-21 | Toast | $22.0 | IPO |
| 22-Sep-21 | Freshworks | $10.1 | IPO |
| 23-Sep-21 | Remitly | $6.9 | IPO |
| 28-Sep-21 | Amplitude | $6.4 | Direct Listing |
| 29-Sep-21 | Warby Parker | $6.0 | Direct Listing |
| 14-Oct-21 | GitLab | $11.0 | IPO |
| 27-Oct-21 | Rent the Runway | $1.7 | IPO |
| 29-Oct-21 | Udemy | $4.0 | IPO |
| 03-Nov-21 | Allbirds | $2.2 | IPO |
| 04-Nov-21 | NerdWallet | $1.2 | IPO |
| 10-Nov-21 | Rivian | $66.5 | IPO |
| 10-Nov-21 | Expensify | $2.2 | IPO |
| 11-Nov-21 | Winc | - | IPO |
| 11-Nov-21 | Weave | - | IPO |
| 17-Nov-21 | UserTesting | - | IPO |
| 17-Nov-21 | Braze | $6.0 | IPO |
| 18-Nov-21 | Sweetgreen | $3.0 | IPO |
| 09-Dec-21 | Nubank | $41.0 | IPO |
Though there are many well-known names in the list, one of the biggest through lines continues to be the importance of tech.
A majority of 2021’s newly public companies have been in tech, including multiple mobile apps, websites, and online services. The two biggest IPOs so far were South Korea’s Coupang, an online marketplace valued at $60 billion after going public, and China’s ride-hailing app Didi Chuxing, the year’s largest post-IPO valuation at $73 billion.
And there were many apps and services going public through other means as well. Gaming company Roblox went public through a direct listing, earning a valuation of $30 billion, and cryptocurrency platform Coinbase has earned the year’s largest valuation so far, with an $86 billion valuation following its direct listing.
Big Companies Going Public in 2022
As with every year, some of the biggest companies going public were lined up for the later half.
Tech will continue to be the talk of the markets. Payment processing firm Stripe was setting up to be the year’s biggest IPO with an estimated valuation of $95 billion, but got delayed. Likewise, online grocery delivery platform InstaCart, which saw a big upswing in traction due to the pandemic, has been looking to go public at a valuation of at least $39 billion.
Of course, it’s common that potential public listings and offerings fall through. Whether they get delayed due to weak market conditions or cancelled at the last minute, anything can happen when it comes to public markets.
This post has been updated as of January 1, 2022.


Green
How Carbon Credits Can Help Close the Climate Funding Gap
To keep a 1.5℃ world within reach, global emissions need to fall by as much as 45% by 2030, and carbon credits could help close the gap.


How Carbon Credits Can Help Close the Climate Funding Gap
Governments around the world have committed to the goals of the Paris Agreement, but their climate pledges are insufficient. To keep a 1.5℃ world within reach, global emissions need to fall by as much as 45% by 2030.
Bold and immediate action is essential, but so are resources that will make it happen.
In this graphic, we have partnered with Carbon Streaming to look at the role that the voluntary carbon market and carbon credits can play in closing that gap.
More Funds are Needed for Climate Finance
According to data from the Climate Policy Initiative, climate finance, which includes funds for both adaptation and mitigation, needs to increase at least five-fold, from $1.3T in 2021/2022, to an average $8.6T annually until 2030, and then to just over $10T in the two decades leading up to 2050.
That adds up to a very large number, but consider that in 2022, $7.0T went to fossil fuel subsidies, which almost covers the annual estimated outlay. And the world has shown that when pressed, governments can come up with the money, if the global pandemic is any indication.
Mobilizing Carbon Finance to the Developing World
But the same cannot be said of the developing world, where debt, inequality, and poverty reduce the ability of governments to act. And this is where carbon credits can play an important role. According to analyses from Ecosystem Marketplace, carbon credits help move capital from developed countries, to where funds are needed in the developing world.
For example, in 2019, 69.2% of the carbon credits by volume in the voluntary carbon market were purchased by buyers in Europe, and nearly a third from North America. Compare that to over 90% of the volume of carbon credits sold in the voluntary carbon market in 2022 came from projects that were located outside of those two regions.
Carbon Credits Can Complement Decarbonization Efforts
Carbon credits can also complement decarbonization efforts in the corporate world, where more and more companies have been signing up to reduce emissions. According to the 2022 monitoring report from the Science Based Targets initiative, 4,230 companies around the world had approved targets and commitments, which represented an 88% increase from the prior year. However, as of year end 2022, combined scope 1 and 2 emissions covered by science-based targets totaled approximately 2 GtCO2e, which represents just a fraction of global emissions.
The fine print is that this is just scope 1 and 2 emissions, and doesn’t include scope 3 emissions, which can account for more than 70% of a company’s total emissions. And as these emissions come under greater and greater scrutiny the closer we get to 2030 and beyond, the voluntary carbon credit market could expand exponentially to help meet the need to compensate for these emissions.
Potential Carbon Credit Market Size in 2030
OK, but how big? In 2022, the voluntary carbon credit market was around $2B, but some analysts predict that it could grow to between $5–250 billion by 2030.
| Firm | Low Estimate | High Estimate |
|---|---|---|
| Bain & Company | $15B | $30B |
| Barclays | N/A | $250B |
| Citigroup | $5B | $50B |
| McKinsey & Company | $5B | $50B |
| Morgan Stanley | N/A | $100B |
| Shell / Boston Consulting Group | $10B | $40B |
Morgan Stanley and Barclays were the most bullish on the size of the voluntary carbon credit market in 2030, but the latter firm was even more optimistic about 2050, and predicted that the voluntary carbon credit market could grow to a colossal $1.5 trillion.
Carbon Streaming is Focused on Carbon Credit Integrity
Ultimately, carbon credits could have an important role to play in marshaling the resources needed to keep the world on track to net zero by 2050, and avoiding the worst consequences of a warming world.
Carbon Streaming uses streaming transactions, a proven and flexible funding model, to scale high-integrity carbon credit projects to advance global climate action and UN Sustainable Development Goals.
Learn more at www.carbonstreaming.com.

-

 Green2 weeks ago
The Carbon Footprint of Major Travel Methods
Going on a cruise ship and flying domestically are the most carbon-intensive travel methods.
-

 Green3 weeks ago
Ranking the Top 15 Countries by Carbon Tax Revenue
This graphic highlights France and Canada as the global leaders when it comes to generating carbon tax revenue.
-

 Green3 weeks ago
Ranked: The Countries With the Most Air Pollution in 2023
South Asian nations are the global hotspot for pollution. In this graphic, we rank the world’s most polluted countries according to IQAir.
-

 Green4 weeks ago
Top Countries By Forest Growth Since 2001
One country is taking reforestation very seriously, registering more than 400,000 square km of forest growth in two decades.
-

 Green1 month ago
Ranked: Top Countries by Total Forest Loss Since 2001
The country with the most forest loss since 2001 lost as much forest cover as the next four countries combined.
-

 Agriculture2 months ago
The World’s Top Cocoa Producing Countries
Here are the largest cocoa producing countries globally—from Côte d’Ivoire to Brazil—as cocoa prices hit record highs.


-

 Markets6 days ago
Visualized: Interest Rate Forecasts for Advanced Economies
-

 Markets2 weeks ago
Economic Growth Forecasts for G7 and BRICS Countries in 2024
-

 Wealth2 weeks ago
Charted: Which City Has the Most Billionaires in 2024?
-

 Technology2 weeks ago
All of the Grants Given by the U.S. CHIPS Act
-
Green2 weeks ago
The Carbon Footprint of Major Travel Methods
-

 United States1 week ago
Visualizing the Most Common Pets in the U.S.
-

 Culture1 week ago
The World’s Top Media Franchises by All-Time Revenue
-

 voronoi1 week ago
Best Visualizations of April on the Voronoi App